

Dobrá díla jsou plodem dobrého charakteru a protože je chvályhodnější příčina než následek, chval více dobrý charakter bez vzdělání než vzdělance bez charakteru.
Leonardo da Vinci
Konference
Konference v roce 2015
Konference v roce 2014
Konference v roce 2013
Konference v roce 2012
Konference v roce 2011


Polní laboratoř
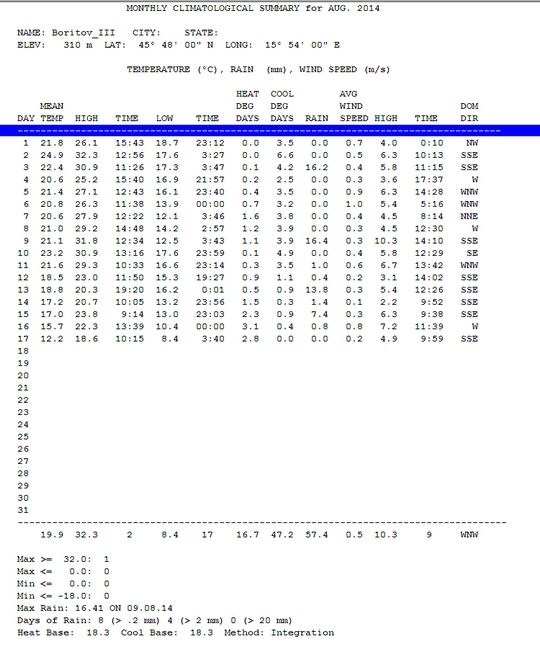
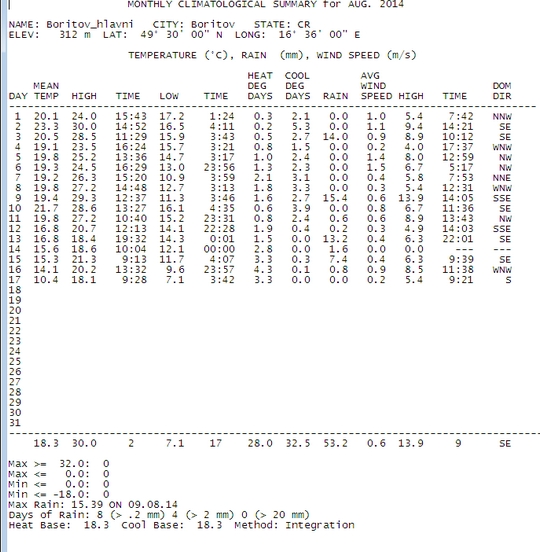
Informace z polní laboratoře – Bořitov
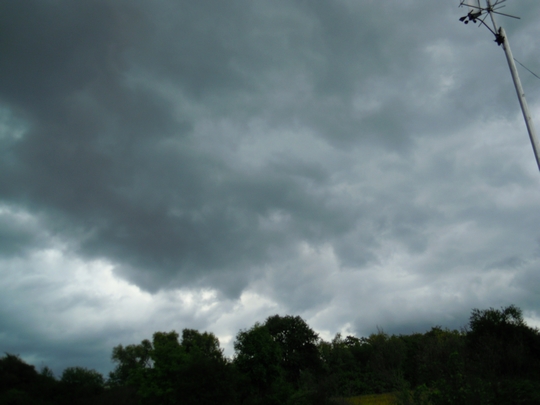
 Nimbostratatus, Cumulus fractus a Stratocumulus 17. 8. 2014, 10:20 UTC, SWS
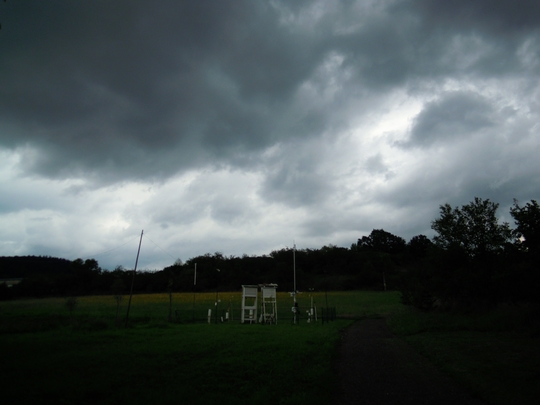 Stratus fractus, Nimbostratatus, Cumulus fractus a Stratocumulus 17. 8. 2014, 10:20 UTC, SWS
 Stratus fractus, Nimbostratatus, Cumulus fractus a Stratocumulus 17. 8. 2014, 10:20 UTC, SWS
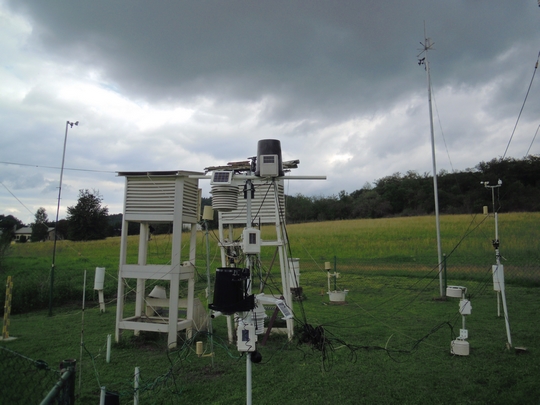
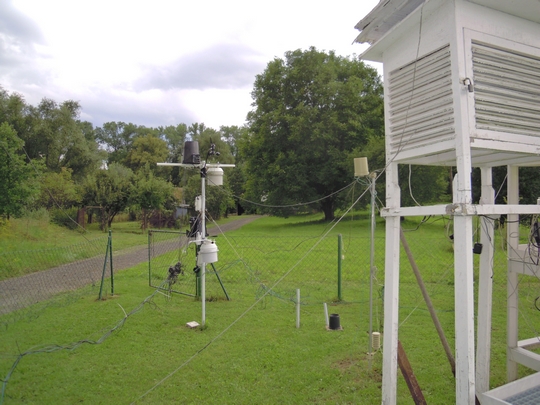
 Stav stanice po úpravě trávníku. Foto 17. 8. 2014 v 10:28 UTC
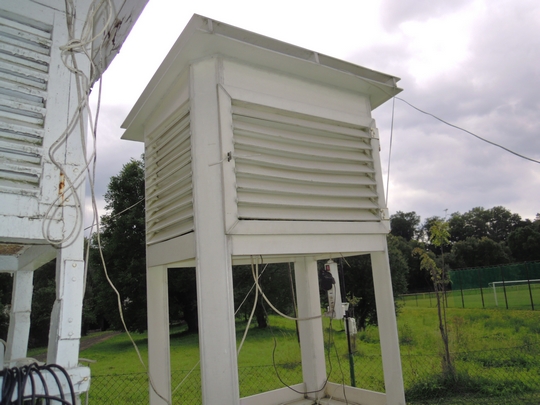 Stav stanice velká žaluziová budka. Foto 17. 8. 2014 v 10:28 UTC
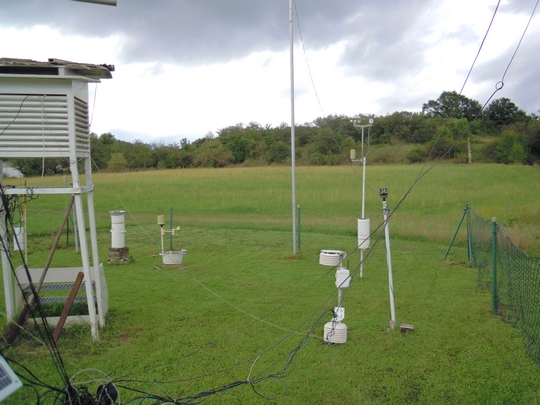
 Stav stanice po úpravě trávníku. Foto 17. 8. 2014 v 10:28 UTC
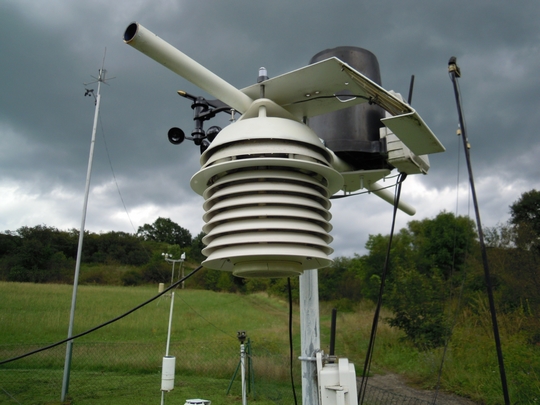
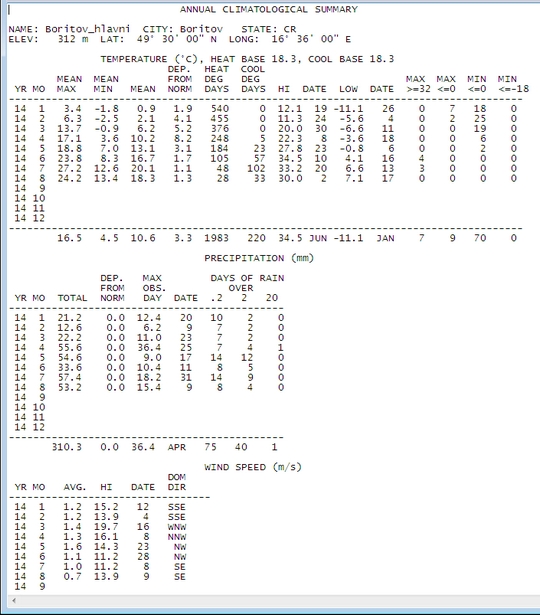
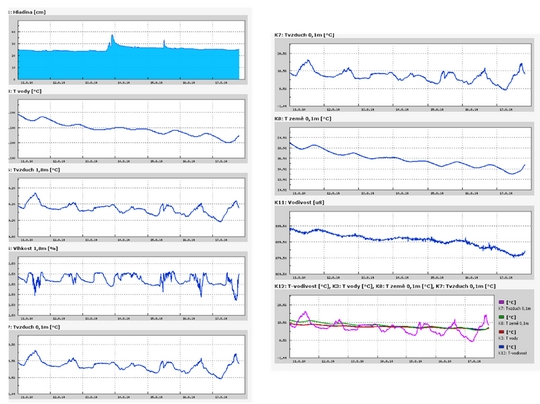
Meteorologické pozorování 1 m nad povrchem trávníku, Bořitov Hlavní stanice
Stav stanice po úpravě trávníku. Foto 17. 8. 2014 v 10:28 UTC
Meteorologické pozorování 1 m nad povrchem trávníku, Bořitov Hlavní stanice
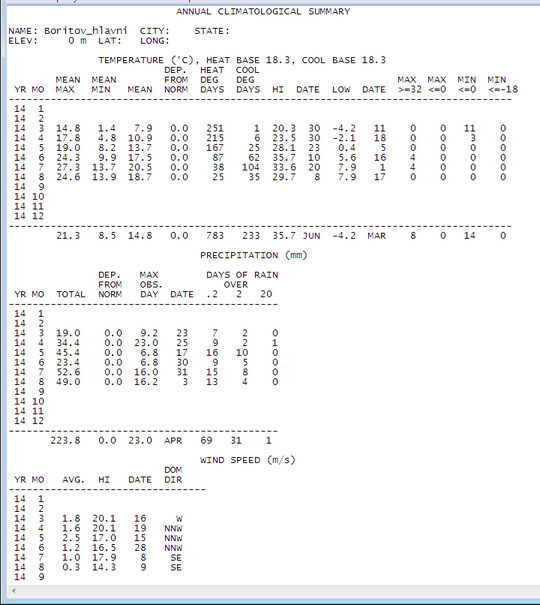
 Meteorologické pozorování 2 m nad povrchem trávníku, Bořitov Hlavní stanice
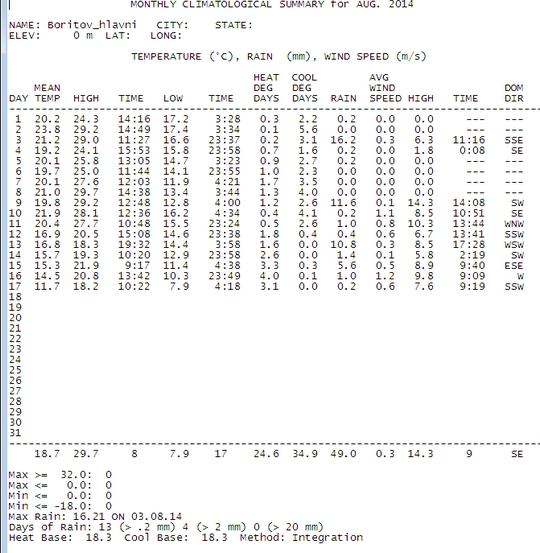
 Meteorologické pozorování, Bořitov letiště
Nimbostratus cloud
 Nimbostratus is a low-to-middle altitude cloud that has considerable vertical and horizontal extent and produces precipitation over a wide area. "Nimbo" is from the Latin word "nimbus", which denotes precipitation. It is a multilevel stratiform layer with a diffuse cloud base generally found anywhere from near surface and about 10000 ft (3000 m). This cloud typically forms from altostratus in the middle altitude range, but it tends to thicken into the low altitude range during precipitation. Although usually dark at its base, it often appears illuminated from within to a surface observer.[1] Nimbostratus usually has a thickness of about 2000 m. Though found worldwide, nimbostratus occurs more commonly in the middle latitudes.[2] Nimbostratus will occur along a warm front where the slowly rising warm air mass creates nimbostratus along with shallower stratus clouds producing less rain, these clouds being preceded by higher-level clouds such as cirrostratus and altostratus clouds.[3][4] Often, when an altostratus cloud thickens and descends into lower altitudes, it will become nimbostratus.[5]
Nimbostratus, unlike cumulonimbus, is not a
ss
ociated with thunderstorms, however at an unusually unstable warm front caused as a result of the advancing warm air being hot, humid and unstable, cumulonimbus clouds may be embedded within the usual nimbostratus. Lightning from an embedded cumulonimbus cloud may interact with the nimbostratus but only in the immediate area around it. In this situation with lightning and rain occurring it would be hard to tell which type of cloud was producing the rain from the ground, however cumulonimbus tend to produce larger droplets and more intense downpours. The occurrence of cumulonimbus and nimbostratus together is uncommon, and usually only nimbostratus is found at a warm front. Nimbostratus fractus is a variation of nimbostratus and will sometimes occur as a weather front clears, these being areas of dark rain bearing clouds with lighter altostratus between.
Lowell is now a large hurricane in the Eastern Pacific and NASA's Aqua and Terra satellites double-teamed it to provide infrared and radar data to scientists. Lowell strengthened into a hurricane during the morning hours of August 21.
When NASA's Aqua satellite passed over Lowell on August 20 at 21:05 UTC (4:05 p.m. EDT), the Atmospheric Infrared Sounder got an infrared look at Lowell's cloud top temperatures when it was still a tropical storm. AIRS showed a very thick band of thunderstorms surrounding the center of circulation and what appeared to be a very small cloud-free center of circulation, like the formation of an eye. Cloud top temperatures exceeded -63F/-52C, the threshold for high, cold thunderstorms with the potential for dropping heavy rainfall.
Nimbostratus is a low-to-middle altitude cloud that has considerable vertical and horizontal extent and produces precipitation over a wide area. "Nimbo" is from the Latin word "nimbus", which denotes precipitation. It is a multilevel stratiform layer with a diffuse cloud base generally found anywhere from near surface and about 10000 ft (3000 m). This cloud typically forms from altostratus in the middle altitude range, but it tends to thicken into the low altitude range during precipitation. Although usually dark at its base, it often appears illuminated from within to a surface observer.[1] Nimbostratus usually has a thickness of about 2000 m. Though found worldwide, nimbostratus occurs more commonly in the middle latitudes.[2] Nimbostratus will occur along a warm front where the slowly rising warm air mass creates nimbostratus along with shallower stratus clouds producing less rain, these clouds being preceded by higher-level clouds such as cirrostratus and altostratus clouds.[3][4] Often, when an altostratus cloud thickens and descends into lower altitudes, it will become nimbostratus.[5]
Nimbostratus, unlike cumulonimbus, is not a
ss
ociated with thunderstorms, however at an unusually unstable warm front caused as a result of the advancing warm air being hot, humid and unstable, cumulonimbus clouds may be embedded within the usual nimbostratus. Lightning from an embedded cumulonimbus cloud may interact with the nimbostratus but only in the immediate area around it. In this situation with lightning and rain occurring it would be hard to tell which type of cloud was producing the rain from the ground, however cumulonimbus tend to produce larger droplets and more intense downpours. The occurrence of cumulonimbus and nimbostratus together is uncommon, and usually only nimbostratus is found at a warm front. Nimbostratus fractus is a variation of nimbostratus and will sometimes occur as a weather front clears, these being areas of dark rain bearing clouds with lighter altostratus between.
Lowell is now a large hurricane in the Eastern Pacific and NASA's Aqua and Terra satellites double-teamed it to provide infrared and radar data to scientists. Lowell strengthened into a hurricane during the morning hours of August 21.
When NASA's Aqua satellite passed over Lowell on August 20 at 21:05 UTC (4:05 p.m. EDT), the Atmospheric Infrared Sounder got an infrared look at Lowell's cloud top temperatures when it was still a tropical storm. AIRS showed a very thick band of thunderstorms surrounding the center of circulation and what appeared to be a very small cloud-free center of circulation, like the formation of an eye. Cloud top temperatures exceeded -63F/-52C, the threshold for high, cold thunderstorms with the potential for dropping heavy rainfall.
A NASA Satellite Double-Take at Hurricane Lowell
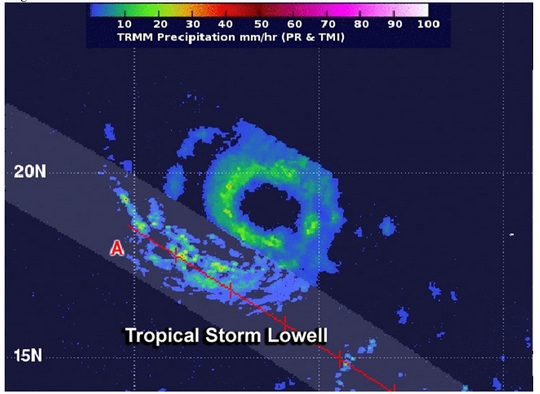 The TRMM or Tropical Rainfall Measuring Mission satellite passed over Lowell on August 21 at 01:14 UTC and captured rainfall rates and cloud height data. TRMM showed that moderate rainfall circled the center of the storm, with rain rates to about 30 mm per hour. A large band of thunderstorms extending southwest of the center also contained moderate rainfall. TRMM found that cloud tops in that band of thunderstorms were about 6.2 miles (10 km) high. TRMM is managed by NASA and the Japan Aerospace Exploration Agency.
Lowell became the seventh hurricane of the Eastern Pacific Ocean season today, August 21 at 11 a.m. EDT (1500 UTC). Maximum sustained winds had increased to 75 mph (120 kph) making Lowell a Category One hurricane on the Saffir-Simpson Wind Scale. Little change in intensity is forecast by the National Hurricane Center (NHC) today, and NHC forecasters expect a slow weakening trend later today through August 22.
It was centered near latitude 20.0 north and longitude 122.1 west, about 810 miles (1,300 km) west-southwest of the southern tip of Baja California, Mexico. It is moving to the northwest near 3 mph (4 kph) and is expected to move faster in that direction over the next two days.
The TRMM or Tropical Rainfall Measuring Mission satellite passed over Lowell on August 21 at 01:14 UTC and captured rainfall rates and cloud height data. TRMM showed that moderate rainfall circled the center of the storm, with rain rates to about 30 mm per hour. A large band of thunderstorms extending southwest of the center also contained moderate rainfall. TRMM found that cloud tops in that band of thunderstorms were about 6.2 miles (10 km) high. TRMM is managed by NASA and the Japan Aerospace Exploration Agency.
Lowell became the seventh hurricane of the Eastern Pacific Ocean season today, August 21 at 11 a.m. EDT (1500 UTC). Maximum sustained winds had increased to 75 mph (120 kph) making Lowell a Category One hurricane on the Saffir-Simpson Wind Scale. Little change in intensity is forecast by the National Hurricane Center (NHC) today, and NHC forecasters expect a slow weakening trend later today through August 22.
It was centered near latitude 20.0 north and longitude 122.1 west, about 810 miles (1,300 km) west-southwest of the southern tip of Baja California, Mexico. It is moving to the northwest near 3 mph (4 kph) and is expected to move faster in that direction over the next two days.
NASA Sees Tropical Storm Lowell's Tough South Side
 The south side of Tropical Storm Lowell appears to be its toughest side. That is, the side with the strongest thunderstorms, according to satellite imagery from NOAA's GOES-14 and NASA-NOAA's Suomi NPP satellites.
NOAA took its GOES-14 satellite out of storage to simulate how the upcoming GOES-R satellite will work and captured a lot of data on Tropical Storm Lowell on August 19. Those data were used to create an animation that showed a gradual increase in the organization of a band of thunderstorms during the day.
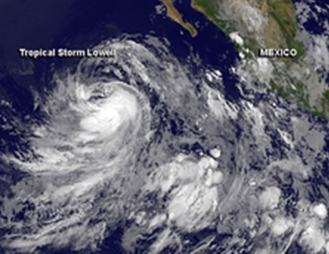
The Visible Infrared Imaging Radiometer Suite (VIIRS) instrument that flies aboard NASA-NOAA's Suomi NPP satellite captured a visible image of Tropical Storm Lowell on August 19 at 21:42 UTC (5:42 p.m. EDT). The image showed a thick band of thunderstorms southwest of the center of circulation, wrapping into the center.
At 5 a.m. EDT on Wednesday, August 20, the National Hurricane Center (NHC) noted that curved bands of thunderstorms remained well organized on the south side of the circulation, but strong showers and thunderstorms were lacking to the north of the center.
At the same time, the center of Tropical Storm Lowell was located near latitude 18.7 north and longitude 121.0 west. That's about 775 miles (1,245 km) west-southwest of the southern tip of Baja California. Maximum sustained winds remain near 50 mph (85 kph). Lowell was moving toward the northwest near 5 mph (7 kph) and the NHC expects a slow northwest to north-northwest motion during the next day or so.
Forecaster Cangialosi at NHC noted that Lowell is currently over 27C/80.6F waters, and in an atmosphere of fairly low shear and high moisture. Tropical cyclones need waters at least near 26.6C/80F to maintain strength. Since the storm is expected to remain in these favorable conditions for another day and a half, some strengthening is forecast.
The south side of Tropical Storm Lowell appears to be its toughest side. That is, the side with the strongest thunderstorms, according to satellite imagery from NOAA's GOES-14 and NASA-NOAA's Suomi NPP satellites.
NOAA took its GOES-14 satellite out of storage to simulate how the upcoming GOES-R satellite will work and captured a lot of data on Tropical Storm Lowell on August 19. Those data were used to create an animation that showed a gradual increase in the organization of a band of thunderstorms during the day.
The Visible Infrared Imaging Radiometer Suite (VIIRS) instrument that flies aboard NASA-NOAA's Suomi NPP satellite captured a visible image of Tropical Storm Lowell on August 19 at 21:42 UTC (5:42 p.m. EDT). The image showed a thick band of thunderstorms southwest of the center of circulation, wrapping into the center.
At 5 a.m. EDT on Wednesday, August 20, the National Hurricane Center (NHC) noted that curved bands of thunderstorms remained well organized on the south side of the circulation, but strong showers and thunderstorms were lacking to the north of the center.
At the same time, the center of Tropical Storm Lowell was located near latitude 18.7 north and longitude 121.0 west. That's about 775 miles (1,245 km) west-southwest of the southern tip of Baja California. Maximum sustained winds remain near 50 mph (85 kph). Lowell was moving toward the northwest near 5 mph (7 kph) and the NHC expects a slow northwest to north-northwest motion during the next day or so.
Forecaster Cangialosi at NHC noted that Lowell is currently over 27C/80.6F waters, and in an atmosphere of fairly low shear and high moisture. Tropical cyclones need waters at least near 26.6C/80F to maintain strength. Since the storm is expected to remain in these favorable conditions for another day and a half, some strengthening is forecast.
Aug. 19, 2014 - NASA Sees Depression 12-E Become Tropical Storm Lowell
 In less than 24 hours after Tropical Depression 12-E was born in the eastern Pacific Ocean it strengthened into Tropical Storm Lowell. NOAA's GOES-West and NASA's Aqua satellite captured infrared images of the massive storm as it continues to strengthen.
On August 18 at 21:11 UTC (5:11 p.m. EDT), NASA's Aqua satellite passed over the Eastern Pacific and the Atmospheric Infrared Sounder (AIRS) instrument gathered infrared data on Lowell's clouds and sea surface temperatures. The AIRS infrared data showed that powerful thunderstorms stretching high into the troposphere (lowest layer of atmosphere) surrounded the center of the tropical cyclone and appeared in fragmented bands south and east of the center. Cloud top temperatures were near -63F/-52C, indicative of high cloud tops with storms packing a potential for heavy rain.
AIRS data is made into imagery and false-colored to better show temperature. The images are created at NASA's Jet Propulsion Laboratory in Pasadena, California.
On August 19 at 5 a.m. EDT, the National Hurricane Center discussion noted that Lowell's cloud pattern has become better organized during the last several hours with the associated banding features now beginning to wrap around the center.
NOAA's GOES-West satellite caught an infrared picture of Lowell at 0900 UTC (5 a.m. EDT) on August 19 that showed thick bands of thunderstorms wrapping into the center from the south and east. The image was created by NASA/NOAA's GOES Project at the NASA Goddard Space Flight Center in Greenbelt, Maryland. NOAA manages the GOES satellites and the NASA/NOAA GOES Project creates images and animations using the data.
At 5 a.m. EDT (0900 UTC) the center of Tropical Storm Lowell was located near latitude 17.3 north and longitude 119.0 west. That's about 705 miles (1,135 km) west-southwest of the southern tip of Baja California, Mexico. Lowell was moving toward the west-northwest near 7 mph (11 kph) and the NHC expects a turn to the northwest and north-northwest. Maximum sustained winds have increased to near 50 mph (85 kph) and some additional strengthening is forecast during the next two days. There are no watches or warnings in effect for this system.
NHC forecaster Cangliosi noted that "Lowell is expected to remain in an environment of moderate shear, high moisture, and over relatively warm water for another couple of days. These conditions should allow for some additional strengthening
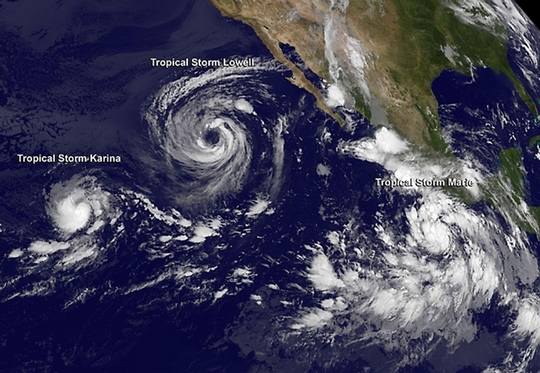
The Eastern Pacific has generated the twelfth tropical depression of the hurricane season, and satellite imagery showed that it dwarfs nearby Tropical Storm Karina.
Tropical cyclones are usually a couple of hundred miles in diameter. The average size of a tropical cyclone is around 304 nautical miles (350 miles/600 km) in diameter. The National Hurricane Center noted on August 18 at 11 a.m. EDT that Tropical Depression 12-E was at least 800 nautical miles (920.6 miles/1,482 km) in diameter! By comparison, Tropical Storm Karina is a couple of hundred miles in diameter. At 11 a.m. EDT on August 18, tropical-storm-force winds extended outward up to 80 miles (130 km) from Karina's center.
NASA/NOAA's GOES Project at the NASA Goddard Space Flight Center in Greenbelt, Maryland generates visible and infrared satellite imagery of the Eastern and Central Pacific Oceans from NOAA's GOES-West and GOES-East satellites.
On August 18, at 11 a.m. EDT (1500 UTC) the center of Tropical Depression Twelve-e was located near latitude 16.7 north and longitude 117.7 west, that's about 665 miles (1,065 km) southwest of the southern tip of Baja California. Maximum sustained winds are near 35 mph (55 kph), and the depression is expected to become a tropical storm late on August 18. The depression is moving toward the west-northwest near 8 mph (13 kph) and the National Hurricane Center expects a turn toward the northwest followed by a turn north on August 19.
In less than 24 hours after Tropical Depression 12-E was born in the eastern Pacific Ocean it strengthened into Tropical Storm Lowell. NOAA's GOES-West and NASA's Aqua satellite captured infrared images of the massive storm as it continues to strengthen.
On August 18 at 21:11 UTC (5:11 p.m. EDT), NASA's Aqua satellite passed over the Eastern Pacific and the Atmospheric Infrared Sounder (AIRS) instrument gathered infrared data on Lowell's clouds and sea surface temperatures. The AIRS infrared data showed that powerful thunderstorms stretching high into the troposphere (lowest layer of atmosphere) surrounded the center of the tropical cyclone and appeared in fragmented bands south and east of the center. Cloud top temperatures were near -63F/-52C, indicative of high cloud tops with storms packing a potential for heavy rain.
AIRS data is made into imagery and false-colored to better show temperature. The images are created at NASA's Jet Propulsion Laboratory in Pasadena, California.
On August 19 at 5 a.m. EDT, the National Hurricane Center discussion noted that Lowell's cloud pattern has become better organized during the last several hours with the associated banding features now beginning to wrap around the center.
NOAA's GOES-West satellite caught an infrared picture of Lowell at 0900 UTC (5 a.m. EDT) on August 19 that showed thick bands of thunderstorms wrapping into the center from the south and east. The image was created by NASA/NOAA's GOES Project at the NASA Goddard Space Flight Center in Greenbelt, Maryland. NOAA manages the GOES satellites and the NASA/NOAA GOES Project creates images and animations using the data.
At 5 a.m. EDT (0900 UTC) the center of Tropical Storm Lowell was located near latitude 17.3 north and longitude 119.0 west. That's about 705 miles (1,135 km) west-southwest of the southern tip of Baja California, Mexico. Lowell was moving toward the west-northwest near 7 mph (11 kph) and the NHC expects a turn to the northwest and north-northwest. Maximum sustained winds have increased to near 50 mph (85 kph) and some additional strengthening is forecast during the next two days. There are no watches or warnings in effect for this system.
NHC forecaster Cangliosi noted that "Lowell is expected to remain in an environment of moderate shear, high moisture, and over relatively warm water for another couple of days. These conditions should allow for some additional strengthening
The Eastern Pacific has generated the twelfth tropical depression of the hurricane season, and satellite imagery showed that it dwarfs nearby Tropical Storm Karina.
Tropical cyclones are usually a couple of hundred miles in diameter. The average size of a tropical cyclone is around 304 nautical miles (350 miles/600 km) in diameter. The National Hurricane Center noted on August 18 at 11 a.m. EDT that Tropical Depression 12-E was at least 800 nautical miles (920.6 miles/1,482 km) in diameter! By comparison, Tropical Storm Karina is a couple of hundred miles in diameter. At 11 a.m. EDT on August 18, tropical-storm-force winds extended outward up to 80 miles (130 km) from Karina's center.
NASA/NOAA's GOES Project at the NASA Goddard Space Flight Center in Greenbelt, Maryland generates visible and infrared satellite imagery of the Eastern and Central Pacific Oceans from NOAA's GOES-West and GOES-East satellites.
On August 18, at 11 a.m. EDT (1500 UTC) the center of Tropical Depression Twelve-e was located near latitude 16.7 north and longitude 117.7 west, that's about 665 miles (1,065 km) southwest of the southern tip of Baja California. Maximum sustained winds are near 35 mph (55 kph), and the depression is expected to become a tropical storm late on August 18. The depression is moving toward the west-northwest near 8 mph (13 kph) and the National Hurricane Center expects a turn toward the northwest followed by a turn north on August 19.
NASA's Infrared Data Shows Newborn Tropical Storm Marie Came Together
 Powerful thunderstorms in newborn Tropical Storm Marie were seen stretching toward the top of the troposphere in infrared imagery from NASA's Aqua satellite.
NASA's Aqua satellite passed over Tropical Storm Marie on Aug. 21 at 20:05 UTC when it was still classified as a low pressure area. The Atmospheric Infrared Sounder or AIRS instrument aboard Aqua read cloud top temperatures in the storm, and showed cloud tops as cold as -63F/-52C around the storm's center and in bands of thunderstorms east and south of the center. AIRS data showed that Marie is located in very warm waters with surface temperatures near 30 Celsius (85 Fahrenheit), which will assist the storm in development and intensification. Sea surface temperatures of at least 26.6C (80F) are needed to maintain a tropical cyclone, while warmer sea surface temperatures can help in evaporation and thunderstorm development. Marie came together off of Mexico's southwestern coast at 11 p.m. EDT on August 21 consolidating into Tropical Depression 13-E. By 5 a.m. EDT on August 22, the depression strengthened into Tropical Storm Marie.
Marie's maximum sustained winds increased to near 45 mph (75 kph) and the National Hurricane Center (NHC) expects rapid intensification. In fact, forecasters expect Marie to become a hurricane late in the day on August 22 and reach major hurricane status (Category 3 or greater on the Saffir-Simpson Wind Scale) by Monday, August 25.
At 5 a.m. EDT, August 22, the center of Tropical Storm Marie was located near latitude 12.8 north and longitude 101.0 west. Marie is moving toward the west-northwest near 16 mph (26 kph) and is expected to slow as it intensifies. The estimated minimum central pressure is 1004 millibars.
The NHC noted that satellite microwave data showed that Marie has a well-defined low-level ring, which can often be a precursor to rapid intensification if environmental conditions are favorable.
Powerful thunderstorms in newborn Tropical Storm Marie were seen stretching toward the top of the troposphere in infrared imagery from NASA's Aqua satellite.
NASA's Aqua satellite passed over Tropical Storm Marie on Aug. 21 at 20:05 UTC when it was still classified as a low pressure area. The Atmospheric Infrared Sounder or AIRS instrument aboard Aqua read cloud top temperatures in the storm, and showed cloud tops as cold as -63F/-52C around the storm's center and in bands of thunderstorms east and south of the center. AIRS data showed that Marie is located in very warm waters with surface temperatures near 30 Celsius (85 Fahrenheit), which will assist the storm in development and intensification. Sea surface temperatures of at least 26.6C (80F) are needed to maintain a tropical cyclone, while warmer sea surface temperatures can help in evaporation and thunderstorm development. Marie came together off of Mexico's southwestern coast at 11 p.m. EDT on August 21 consolidating into Tropical Depression 13-E. By 5 a.m. EDT on August 22, the depression strengthened into Tropical Storm Marie.
Marie's maximum sustained winds increased to near 45 mph (75 kph) and the National Hurricane Center (NHC) expects rapid intensification. In fact, forecasters expect Marie to become a hurricane late in the day on August 22 and reach major hurricane status (Category 3 or greater on the Saffir-Simpson Wind Scale) by Monday, August 25.
At 5 a.m. EDT, August 22, the center of Tropical Storm Marie was located near latitude 12.8 north and longitude 101.0 west. Marie is moving toward the west-northwest near 16 mph (26 kph) and is expected to slow as it intensifies. The estimated minimum central pressure is 1004 millibars.
The NHC noted that satellite microwave data showed that Marie has a well-defined low-level ring, which can often be a precursor to rapid intensification if environmental conditions are favorable.
Archiv
31_201430_2014
29_2014
29_2014
28_2014
27_2014
26_2014
26_2014
25_2014
24_2014
23_2014
22_2014
21_2014
20_2014
20_2014
20_2014
19_2014
18_2014
17_2014
16_2014
15_2014
14_2014
54_2013
53_2013
52_2013
51_2013
50_2013
49_2013
48_2013
47_2013
46_2013
45_2013
44_2013
43_2013
42_2013
41_2013
40_2013
39_2013
38_2013
37_2013
36_2013
35_2013
34_2013
33_2013
32_2013
31_2013
30_2013
29_2013
28_2013
27_2013
26_2013
25_2013
24_2013
23_2013
22_2013
21_2013
20_2013
19_2013
18_2013
17_2013
16_2013
15_2013
14_2013
13_2013
12_2013
11_2013
10_2013
09_2013
08_2013
07_2013
06_2013
05_2013
04_2013
03_2013
02_2013
01_2013

 | Zemědělská 1/1665 613 00 Brno Budova D | Tel.: +420 545 133 350 Fax.: +420 545 212 044 |  |
 |