

Každý, kdo se přestane učit, je starý, ať je mu 20 nebo 80. Každý, kdo se stále učí, zůstává mladý. Je nejlepší v životě zůstat mladý.
Henry Ford
Konference
Konference v roce 2015
Konference v roce 2014
Konference v roce 2013
Konference v roce 2012
Konference v roce 2011


Polní laboratoř
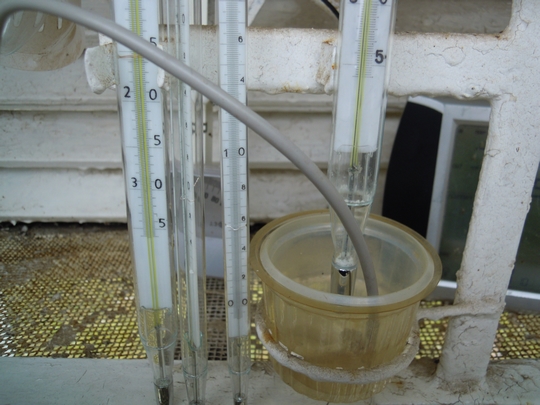 Meteorological thermometer in meteorological shelter (02.02.2014)
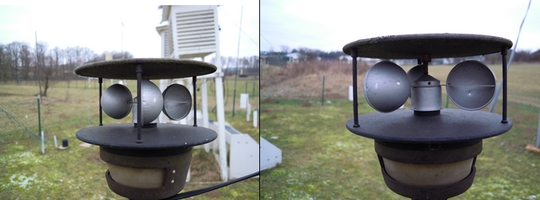 Meteorological anemomother (02.02.2014)
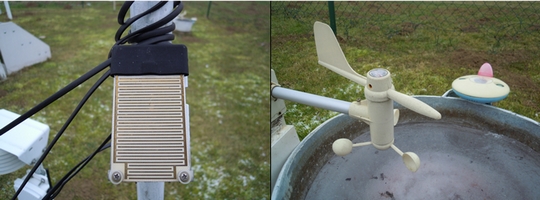 Meteorological wet sensor and vapor measurement (02.02.2014)
Arctic lakes show climate on thin ice
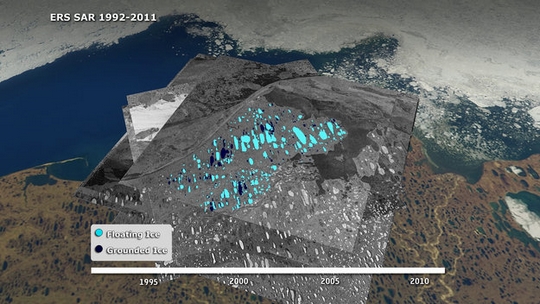 Ice in northern Alaska’s lakes during winter months is on the decline. Twenty years of satellite radar imagery show how changes in our climate are affecting high-latitude environments. Changes in air temperature and winter precipitation over the last five decades have affected the timing, duration and thickness of the ice cover on lakes in the Arctic. In this region, warmer climate conditions result in thinner ice cover on shallow lakes and, consequently, a smaller fraction of lakes freezing all the way through during winter months. These changes in ice cover affect the local and regional climate, the dynamics of the underlying permafrost and the availability of water for residential and industrial use throughout the winter. They also alter the physical, thermal and chemical properties of the water, affecting the ecology dependent on them. But the magnitude of these changes had not yet been comprehensively documented until now.
In a recent study of Alaska’s North Slope, published in The Cryosphere, the ice regimes of shallow lakes were documented using radar images from ESA’s ERS-1 and -2 satellites. The study reveals a 22% decrease of ‘grounded ice’ – or ice frozen through to the lakebed – from 1991 to 2011. This is equivalent to an overall thinning of ice by 21–38 cm. “Prior to starting our analysis, we were expecting to find a decline in ice thickness and grounded ice based on our examination of temperature and precipitation records of the past five decades from the Barrow meteorological station,” said Cristina Surdu, lead author of the study.
“At the end of the analysis, when looking at trend analysis results, we were stunned to observe such a dramatic ice decline during a period of only 20 years.”
The greatest change was observed during late winter (April–May) over the 20-year period, which gradually decreased from 1991 to 2005. The ice experienced a more abrupt decline during the final six years of the analysis, reaching its lowest in 2011. Radars such as those on the ERS mission can ‘see’ through clouds and in the dark, providing continuous imagery over areas like northern Alaska that are prone to bad weather and long periods of darkness. How the radar signals bounce back can also be used to determine if the lake ice was grounded or ‘floating’ (with water underneath).
ERS-1 operations ended in 2000 and ERS-2 retired in 2011.
While radar imagery from these two satellites, as well as from the Envisat mission – which ended in 2012 – allowed adequate monitoring of freezing lakes, continued coverage would improve the investigation of ice regimes at high latitudes.
The upcoming Sentinel-1 mission of the Copernicus programme will provide more frequent coverage of this area while ensuring global continuity of radar acquisitions for operational lake-ice monitoring.
Ice in northern Alaska’s lakes during winter months is on the decline. Twenty years of satellite radar imagery show how changes in our climate are affecting high-latitude environments. Changes in air temperature and winter precipitation over the last five decades have affected the timing, duration and thickness of the ice cover on lakes in the Arctic. In this region, warmer climate conditions result in thinner ice cover on shallow lakes and, consequently, a smaller fraction of lakes freezing all the way through during winter months. These changes in ice cover affect the local and regional climate, the dynamics of the underlying permafrost and the availability of water for residential and industrial use throughout the winter. They also alter the physical, thermal and chemical properties of the water, affecting the ecology dependent on them. But the magnitude of these changes had not yet been comprehensively documented until now.
In a recent study of Alaska’s North Slope, published in The Cryosphere, the ice regimes of shallow lakes were documented using radar images from ESA’s ERS-1 and -2 satellites. The study reveals a 22% decrease of ‘grounded ice’ – or ice frozen through to the lakebed – from 1991 to 2011. This is equivalent to an overall thinning of ice by 21–38 cm. “Prior to starting our analysis, we were expecting to find a decline in ice thickness and grounded ice based on our examination of temperature and precipitation records of the past five decades from the Barrow meteorological station,” said Cristina Surdu, lead author of the study.
“At the end of the analysis, when looking at trend analysis results, we were stunned to observe such a dramatic ice decline during a period of only 20 years.”
The greatest change was observed during late winter (April–May) over the 20-year period, which gradually decreased from 1991 to 2005. The ice experienced a more abrupt decline during the final six years of the analysis, reaching its lowest in 2011. Radars such as those on the ERS mission can ‘see’ through clouds and in the dark, providing continuous imagery over areas like northern Alaska that are prone to bad weather and long periods of darkness. How the radar signals bounce back can also be used to determine if the lake ice was grounded or ‘floating’ (with water underneath).
ERS-1 operations ended in 2000 and ERS-2 retired in 2011.
While radar imagery from these two satellites, as well as from the Envisat mission – which ended in 2012 – allowed adequate monitoring of freezing lakes, continued coverage would improve the investigation of ice regimes at high latitudes.
The upcoming Sentinel-1 mission of the Copernicus programme will provide more frequent coverage of this area while ensuring global continuity of radar acquisitions for operational lake-ice monitoring.
NASA's Aqua Satellite Tracking System 94P or "Fletcher" Near Queensland
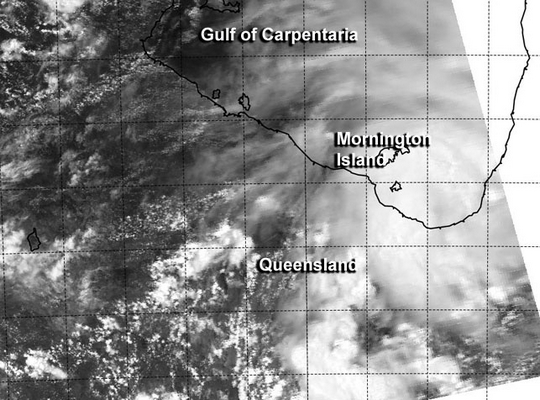 A tropical low pressure area known as "System 94P" has tracked across western Queensland and moved into the Gulf of Carpentaria between Karumba and Gilbert River Mouth on February 3 as NASA's Aqua satellite passed overhead.
System 94P continues to struggle to organize into a tropical depression, and the Australian Bureau of Meteorology or ABM has dubbed the storm "Fletcher." ABM expects the low pressure area to bring heavy rain to the Gulf Country district, mostly to coastal parts areas over the next couple of days. ABM noted that Kowanyama recorded 5.7 inches /147 mm of rain on Feb. 3 and it was still raining.
ABM posted Cyclone Warning for coastal and island communities from Mornington Island to Gilbert River Mouth, and a Cyclone Watch was in effect for coastal areas from the Northern Territory and Queensland border to Mornington Island.
The Moderate Resolution Imaging Spectroradiometer or MODIS instrument aboard NASA's Aqua satellite captured a visible image of System 94P as it moved into the Gulf of Carpentaria and its northwestern quadrant covered Mornington Island and Bentick Island. Half of the tropical low was over the Gulf and the other half was over land.
At 0400 UTC on February 3, maximum sustained winds were estimated to be near 30 knots/34.5 mph/55.5 kph. The Joint Typhoon Warning Center or JTWC has issued Tropical Cyclone Formation Alert WTPS21, as forecasters expect the low to strengthen into tropical depression status. System 94P was centered near 17.3 south and 140.0 east, about 50 nautical miles/57.5 miles/92.6 kph southeast of Mornington Island.
The JTWC noted that animated multispectral satellite imagery showed that the well-defined low-level center was consolidating over the open waters, and that strong bands of thunderstorms were wrapping into the center. Radar imagery from Mornington Island confirmed the strong thunderstorms and the well-defined center of circulation.
A tropical low pressure area known as "System 94P" has tracked across western Queensland and moved into the Gulf of Carpentaria between Karumba and Gilbert River Mouth on February 3 as NASA's Aqua satellite passed overhead.
System 94P continues to struggle to organize into a tropical depression, and the Australian Bureau of Meteorology or ABM has dubbed the storm "Fletcher." ABM expects the low pressure area to bring heavy rain to the Gulf Country district, mostly to coastal parts areas over the next couple of days. ABM noted that Kowanyama recorded 5.7 inches /147 mm of rain on Feb. 3 and it was still raining.
ABM posted Cyclone Warning for coastal and island communities from Mornington Island to Gilbert River Mouth, and a Cyclone Watch was in effect for coastal areas from the Northern Territory and Queensland border to Mornington Island.
The Moderate Resolution Imaging Spectroradiometer or MODIS instrument aboard NASA's Aqua satellite captured a visible image of System 94P as it moved into the Gulf of Carpentaria and its northwestern quadrant covered Mornington Island and Bentick Island. Half of the tropical low was over the Gulf and the other half was over land.
At 0400 UTC on February 3, maximum sustained winds were estimated to be near 30 knots/34.5 mph/55.5 kph. The Joint Typhoon Warning Center or JTWC has issued Tropical Cyclone Formation Alert WTPS21, as forecasters expect the low to strengthen into tropical depression status. System 94P was centered near 17.3 south and 140.0 east, about 50 nautical miles/57.5 miles/92.6 kph southeast of Mornington Island.
The JTWC noted that animated multispectral satellite imagery showed that the well-defined low-level center was consolidating over the open waters, and that strong bands of thunderstorms were wrapping into the center. Radar imagery from Mornington Island confirmed the strong thunderstorms and the well-defined center of circulation.
NASA Sees Tropical Cyclone Edna Affecting New Caledonia
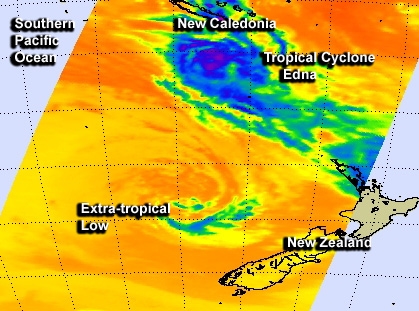 NASA's Aqua satellite spotted two storms in one image in the Southern Pacific Ocean as Tropical Cyclone Edna brushes by New Caledonia and an extra-tropical storm lingers west of New Zealand.New Caledonia warnings were still in effect on February 5 as Edna continues moving along the southwestern part of the island. An Amber Alert was in effect for the whole southern province as well as the community of Canala and a Yellow Alert was in effect for the rest of the territory.
NASA's Aqua satellite passed over the area of the Southern Pacific Ocean where Tropical Cyclone Edna was positioned, about 89 nautical miles west of New Caledonia. It was centered near 22.1 south and 164.5 east and moving south-southeast at 20 knots. Edna's maximum sustained winds were near 50 knots and tropical storm force winds were affecting New Caledonia. Edna was also generating wave heights to 19 feet as it continued to move parallel to New Caledonia today, February 5.
AIRS and multispectral data showed that the convection (rising air that forms the thunderstorms that make up the tropical cyclone) have begun to break up on the southern side of the storm where wind shear is increasing.
The Joint Typhoon Warning Center expects Edna to maintain intensity as it moves southeast over the next couple of days. As Edna moves southeast it is expected to encounter cooler waters and stronger wind shear that are expected to weaken and dissipate the storm as it nears northern New Zealand.
An extra-tropical low pressure area located west of New Zealand also appeared in the AIRS imagery. AIRS data showed that the strongest storms associated with it were southeast of the center. The low is expected to move to the north and the west and away from New Zealand, according to the New Zealand Met Service or NZMS. NZMS noted that high pressure located to the southeast of New Zealand is expected to push the extra-tropical low away.
NASA's Aqua satellite spotted two storms in one image in the Southern Pacific Ocean as Tropical Cyclone Edna brushes by New Caledonia and an extra-tropical storm lingers west of New Zealand.New Caledonia warnings were still in effect on February 5 as Edna continues moving along the southwestern part of the island. An Amber Alert was in effect for the whole southern province as well as the community of Canala and a Yellow Alert was in effect for the rest of the territory.
NASA's Aqua satellite passed over the area of the Southern Pacific Ocean where Tropical Cyclone Edna was positioned, about 89 nautical miles west of New Caledonia. It was centered near 22.1 south and 164.5 east and moving south-southeast at 20 knots. Edna's maximum sustained winds were near 50 knots and tropical storm force winds were affecting New Caledonia. Edna was also generating wave heights to 19 feet as it continued to move parallel to New Caledonia today, February 5.
AIRS and multispectral data showed that the convection (rising air that forms the thunderstorms that make up the tropical cyclone) have begun to break up on the southern side of the storm where wind shear is increasing.
The Joint Typhoon Warning Center expects Edna to maintain intensity as it moves southeast over the next couple of days. As Edna moves southeast it is expected to encounter cooler waters and stronger wind shear that are expected to weaken and dissipate the storm as it nears northern New Zealand.
An extra-tropical low pressure area located west of New Zealand also appeared in the AIRS imagery. AIRS data showed that the strongest storms associated with it were southeast of the center. The low is expected to move to the north and the west and away from New Zealand, according to the New Zealand Met Service or NZMS. NZMS noted that high pressure located to the southeast of New Zealand is expected to push the extra-tropical low away.
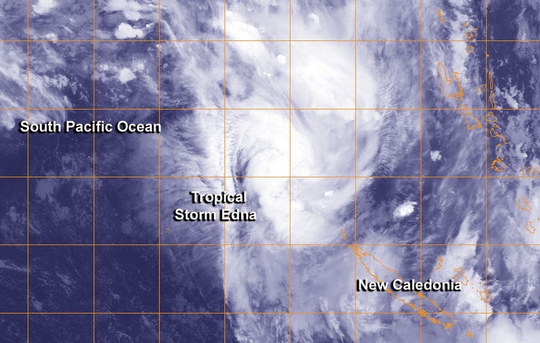
Tropical Storm Edna Moving Toward New Caledonia
 System 93P strengthened between February 3 and 4 into Tropical Depression 12P and then Tropical Storm Edna, northwest New Caledonia. By 1500 UTC/10 a.m. EST Edna was about 392 nautical miles northwest of New Caledonia, near 17.2 south latitude and 161.5 east longitude. Edna had maximum sustained winds near 35 knots/40 mph/62 kph. It was moving to the southeast at 19 knots/21.8 mph/35.1 kph.
NASA's AIRS data showed very cold cloud top temperatures in powerful thunderstorms within Edna that have the potential for heavy rainfall. Infrared data also showed that Edna's circulation has consolidated and convection has deepened/strengthened with bands of thunderstorms, mostly north of the center, were wrapping more tightly into the low-level center of circulation.
AIRS data also showed that sea surface temperatures were around 28C/82.4F, warm enough to contribute to strengthening the system. Sea surface temperatures need to be at least 26.6C/80F in order for a tropical cyclone to maintain intensity. Warmer temperatures than that can help in increased evaporation with the formation of thunderstorms that make up a tropical cyclone. However, as Edna continues tracking southward, the storm will run into cooler sea surface temperatures that will squelch any significant intensification.
System 93P strengthened between February 3 and 4 into Tropical Depression 12P and then Tropical Storm Edna, northwest New Caledonia. By 1500 UTC/10 a.m. EST Edna was about 392 nautical miles northwest of New Caledonia, near 17.2 south latitude and 161.5 east longitude. Edna had maximum sustained winds near 35 knots/40 mph/62 kph. It was moving to the southeast at 19 knots/21.8 mph/35.1 kph.
NASA's AIRS data showed very cold cloud top temperatures in powerful thunderstorms within Edna that have the potential for heavy rainfall. Infrared data also showed that Edna's circulation has consolidated and convection has deepened/strengthened with bands of thunderstorms, mostly north of the center, were wrapping more tightly into the low-level center of circulation.
AIRS data also showed that sea surface temperatures were around 28C/82.4F, warm enough to contribute to strengthening the system. Sea surface temperatures need to be at least 26.6C/80F in order for a tropical cyclone to maintain intensity. Warmer temperatures than that can help in increased evaporation with the formation of thunderstorms that make up a tropical cyclone. However, as Edna continues tracking southward, the storm will run into cooler sea surface temperatures that will squelch any significant intensification.
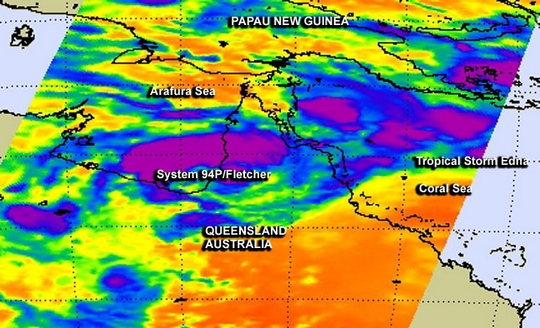
Edna and Stubborn Fletcher
 Northeastern Australia has been watching two tropical low pressure areas over the last several days, and NASA's Aqua satellite captured both in one infrared image. Tropical Storm Edna developed on February 4, while Fletcher, known also as System 94P continued to have a medium chance for development.
On February 3 at 15:53 UTC/10:53 a.m. EST, NASA's Aqua satellite passed over Queensland, Australia and the AIRS or Atmospheric Infrared Sounder instrument captured infrared data on both storms. System 94P/Fletcher was in the Gulf of Carpentaria and over the Northwest region of Queensland, while newborn Edna formed in the South Pacific Ocean east of Queensland.
Northeastern Australia has been watching two tropical low pressure areas over the last several days, and NASA's Aqua satellite captured both in one infrared image. Tropical Storm Edna developed on February 4, while Fletcher, known also as System 94P continued to have a medium chance for development.
On February 3 at 15:53 UTC/10:53 a.m. EST, NASA's Aqua satellite passed over Queensland, Australia and the AIRS or Atmospheric Infrared Sounder instrument captured infrared data on both storms. System 94P/Fletcher was in the Gulf of Carpentaria and over the Northwest region of Queensland, while newborn Edna formed in the South Pacific Ocean east of Queensland.
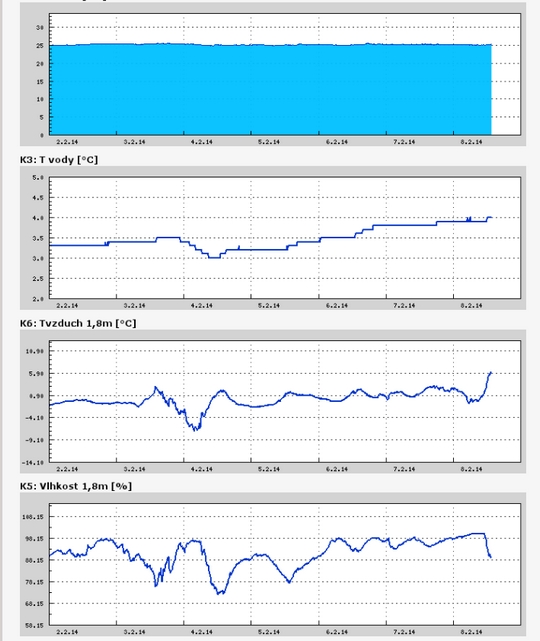
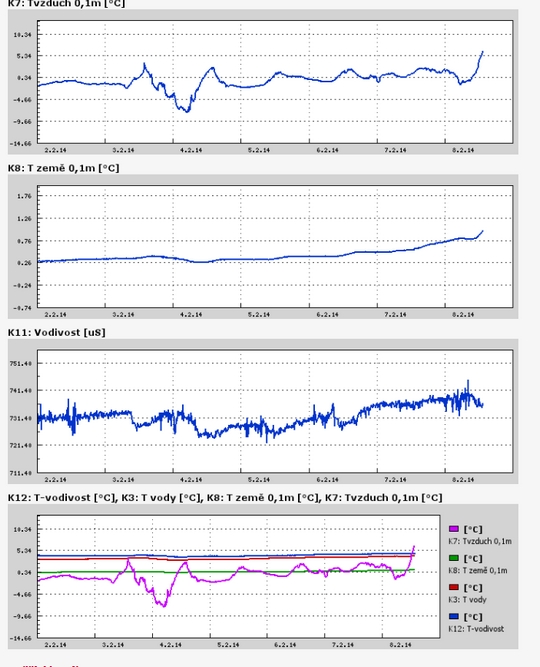
Teplota vzduchu a vody, vlhkost ,
 https://stanice.fiedler-magr.cz
Archiv
47_201346_2013
45_2013
44_2013
43_2013
42_2013
41_2013
40_2013
39_2013
38_2013
37_2013
36_2013
35_2013
34_2013
33_2013
32_2013
31_2013
30_2013
29_2013
28_2013
27_2013
26_2013
25_2013
24_2013
23_2013
22_2013
21_2013
20_2013
19_2013
18_2013
17_2013
16_2013
15_2013
14_2013
13_2013
12_2013
11_2013
10_2013
09_2013
08_2013
07_2013
06_2013
05_2013
04_2013
03_2013
02_2013
01_2013

 | Zemědělská 1/1665 613 00 Brno Budova D | Tel.: +420 545 133 350 Fax.: +420 545 212 044 |  |
 |