

Průměrný učitel vypráví. Dobrý učitel vysvětluje. Výborný učitel ukazuje. Nejlepší učitel inspiruje.
Charles Farrar Browne
Konference
Konference v roce 2015
Konference v roce 2014
Konference v roce 2013
Konference v roce 2012
Konference v roce 2011


Polní laboratoř
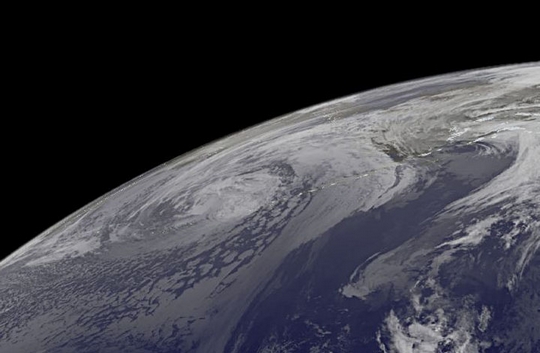
Northern Lights Viewed From the International Space Station
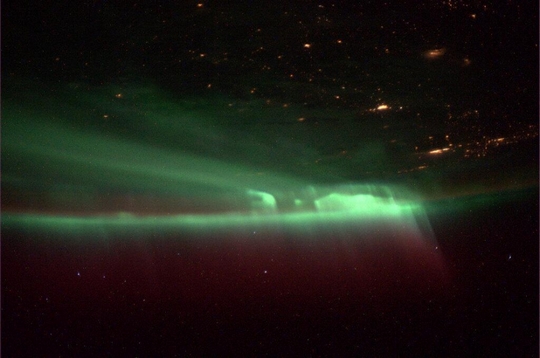 Astronaut Mike Hopkins, aboard the International Space Station, shared this picture of the northern lights on Oct. 9, 2013, saying "The pic doesn't do the northern lights justice. Covered the whole sky. Truly amazing!" The northern lights are caused by collisions between fast-moving particles (electrons) from space and the oxygen and nitrogen gas in our atmosphere. These electrons originate in the magnetosphere, the region of space controlled by Earth’s magnetic field. As they rain into the atmosphere, the electrons impart energy to oxygen and nitrogen molecules, making them excited. When the molecules return to their normal state, they release photons, small bursts of energy in the form of light. Astronauts have used hand-held cameras to photograph the Earth for more than 40 years. Beginning with the Mercury missions in the early 1960s, astronauts have taken more than 700,000 photographs of the Earth. Today, the space station continues the NASA tradition of Earth observation from human-tended spacecraft. Image Credit: NASA
NASA Sees Typhoon Francisco Headed to the Other Side of Guam
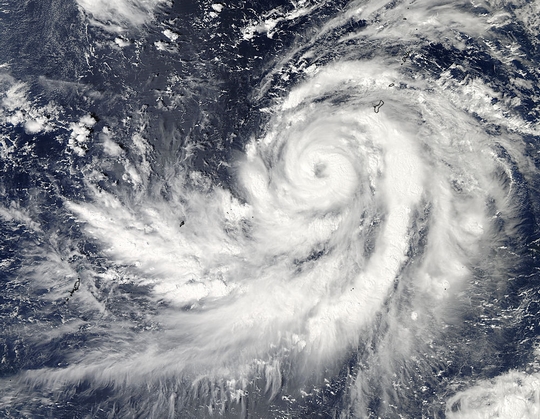 NASA's Aqua satellite passed over Typhoon Francisco on Oct. 17 after it had passed the eastern side of Guam and started to head on a track that would take it past the western side of Guam. Tropical Storm Warnings are in effect for Guam on Oct. 17 and 18 (local time). The Moderate Resolution Imaging Spectroradiometer instrument aboard NASA's Aqua satellite captured an image of Typhoon Francisco on Oct. 17 at 04:05 UTC in the Pacific Ocean as it started turning to the northwest after passing the eastern side Guam. The MODIS image clearly showed Francisco's eye, indicating its strength and organization. On Oct. 17 at 1500 UTC/11 a.m. EDT Francisco had maximum sustained winds near 85 knots and was moving to the north-northeast, but is expected to take a turn to the northwest. Francisco's center was located about 147 nautical miles southwest of Guam, near 12.5 north and 143.1 east.
Tropical Storm Octave Makes Landfall in Western Mexico
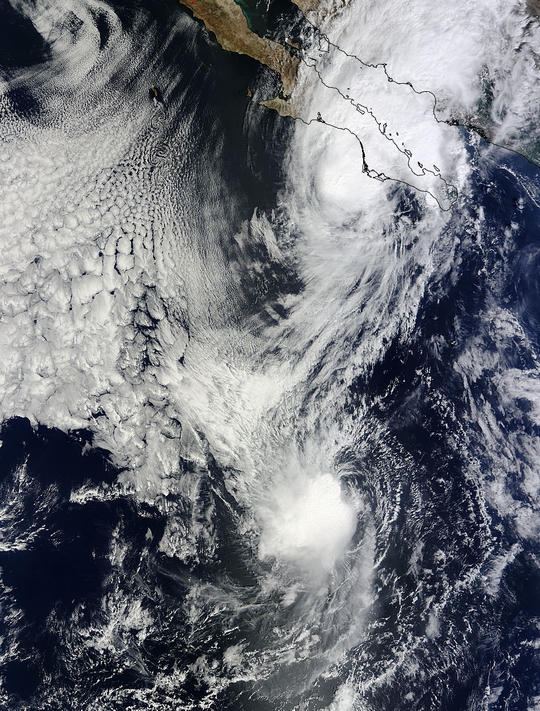 On Oct. 17 and 18 (local time), a Tropical Storm Warning was in effect for Guam. The National Weather Service bulletin on Oct. 17 at 3 p.m. EDT noted: as Typhoon Francisco (26w) passes...sustained tropical storm force winds are expected. Maximum winds are still forecast to be in the 30 to 40 mph range with gusts to 60 mph. Minor damage may occur to poorly constructed homes. Isolated power outages will be possible. Choppy seas of 12 to 14 feet will persist through tonight.Tropical Depression 15-E formed on Oct. 12 at 11 p.m. EDT and strengthened into Tropical Storm Octave. Four days later NASA's Terra satellite saw the weakened storm headed for landfall in western Mexico.TD15-E formed about 470 miles/755 km south of the southern tip of Baja California, near 16.1 north and 110.2 west. By 5 a.m. EDT on Oct. 13, TD15-E became Tropical Storm Octave. Octave's maximum sustained winds peaked at 65 mph/100 kph at 11 p.m. EDT on Oct. 13 when it was about 215 miles/345 km northwest of Socorro Island, near 20.6 north and 113.7 west.The Moderate Resolution Imaging Spectroradiometer aboard NASA's Terra satellite saw Tropical Storm Octave in the Gulf of California and Tropical Storm Priscilla in the open waters of the Eastern Pacific on Oct. 14 at 2:40 p.m. EDT.By 5 p.m. EDT/2100 UTC on Oct. 15, Octave had become a post-tropical cyclone. It was located near latitude 26.9 north and longitude 109.4 west in the Gulf of California, about 80 miles/130 km north-northwest of Los Mochis, Mexico. Maximum sustained winds decreased to near 25 mph/35 kph.
The post-tropical cyclone was moving toward the north-northeast near 5 mph/7 kph and that general motion continued until the system moved over mainland Mexico between Guaymas and Los Mochis. Although Octave dissipated on Oct. 16 the remnants brought large rainfall totals to mainland Mexico, between 3 to 6 inches over the state of Sonora.
On Oct. 17 and 18 (local time), a Tropical Storm Warning was in effect for Guam. The National Weather Service bulletin on Oct. 17 at 3 p.m. EDT noted: as Typhoon Francisco (26w) passes...sustained tropical storm force winds are expected. Maximum winds are still forecast to be in the 30 to 40 mph range with gusts to 60 mph. Minor damage may occur to poorly constructed homes. Isolated power outages will be possible. Choppy seas of 12 to 14 feet will persist through tonight.Tropical Depression 15-E formed on Oct. 12 at 11 p.m. EDT and strengthened into Tropical Storm Octave. Four days later NASA's Terra satellite saw the weakened storm headed for landfall in western Mexico.TD15-E formed about 470 miles/755 km south of the southern tip of Baja California, near 16.1 north and 110.2 west. By 5 a.m. EDT on Oct. 13, TD15-E became Tropical Storm Octave. Octave's maximum sustained winds peaked at 65 mph/100 kph at 11 p.m. EDT on Oct. 13 when it was about 215 miles/345 km northwest of Socorro Island, near 20.6 north and 113.7 west.The Moderate Resolution Imaging Spectroradiometer aboard NASA's Terra satellite saw Tropical Storm Octave in the Gulf of California and Tropical Storm Priscilla in the open waters of the Eastern Pacific on Oct. 14 at 2:40 p.m. EDT.By 5 p.m. EDT/2100 UTC on Oct. 15, Octave had become a post-tropical cyclone. It was located near latitude 26.9 north and longitude 109.4 west in the Gulf of California, about 80 miles/130 km north-northwest of Los Mochis, Mexico. Maximum sustained winds decreased to near 25 mph/35 kph.
The post-tropical cyclone was moving toward the north-northeast near 5 mph/7 kph and that general motion continued until the system moved over mainland Mexico between Guaymas and Los Mochis. Although Octave dissipated on Oct. 16 the remnants brought large rainfall totals to mainland Mexico, between 3 to 6 inches over the state of Sonora.
Tropical Storm Priscilla's Short Life
 Tropical Storm Priscilla lived just 3 days in the eastern Pacific Ocean making for one of the shortest-lived tropical storms of the season. Priscilla skipped the depression phase and went from a low pressure area to a full-blown tropical storm at 5 a.m. EDT/0900 UTC on Oct. 14. Priscilla formed near 14.3 north and 115.7 west, about 705 miles/1,135 km southwest of the southern tip of Baja California. Priscilla moved north-northeast and had maximum sustained winds near 40 mph/65 kph at birth.
On Oct. 15 Priscilla had already weakened to a depression because of wind shear and the arrival of more stable air into the environment around the tropical storm.
At 5 p.m. EDT/2100 UTC, Priscilla's maximum sustained winds dropped to 35 mph/55 kph. The center of tropical depression Priscilla was located near latitude 17.7 north and longitude 117.5, about 610 miles/980 km southwest of the southern tip of Baja California. Priscilla was moving toward the west-northwest near 8 mph/13 kph and this general motion is expected to continue through Oct. 16.
A GOES-West satellite visible image on Oct. 15 at 2215 UTC/6:15 p.m. EDT that showed the bulk of precipitation west of the center from wind shear.
By Oct. 17, Priscilla was a post-tropical cyclone. The last bulletin issued by the National Hurricane Center pinpointed the center near 18.7 north and 120.9 west, about 765 miles west-southwest of Cabo San Lucas, Mexico. The post-tropical cyclone was fading fast as sustained winds dropped to 25 knots/28.7 mph/46.3 kph. The National Hurricane Center noted at 0300 UTC on Oct. 17/11 p.m. EDT Oct. 16, that Priscilla ceased to qualify as a tropical cyclone.
Tropical Storm Priscilla lived just 3 days in the eastern Pacific Ocean making for one of the shortest-lived tropical storms of the season. Priscilla skipped the depression phase and went from a low pressure area to a full-blown tropical storm at 5 a.m. EDT/0900 UTC on Oct. 14. Priscilla formed near 14.3 north and 115.7 west, about 705 miles/1,135 km southwest of the southern tip of Baja California. Priscilla moved north-northeast and had maximum sustained winds near 40 mph/65 kph at birth.
On Oct. 15 Priscilla had already weakened to a depression because of wind shear and the arrival of more stable air into the environment around the tropical storm.
At 5 p.m. EDT/2100 UTC, Priscilla's maximum sustained winds dropped to 35 mph/55 kph. The center of tropical depression Priscilla was located near latitude 17.7 north and longitude 117.5, about 610 miles/980 km southwest of the southern tip of Baja California. Priscilla was moving toward the west-northwest near 8 mph/13 kph and this general motion is expected to continue through Oct. 16.
A GOES-West satellite visible image on Oct. 15 at 2215 UTC/6:15 p.m. EDT that showed the bulk of precipitation west of the center from wind shear.
By Oct. 17, Priscilla was a post-tropical cyclone. The last bulletin issued by the National Hurricane Center pinpointed the center near 18.7 north and 120.9 west, about 765 miles west-southwest of Cabo San Lucas, Mexico. The post-tropical cyclone was fading fast as sustained winds dropped to 25 knots/28.7 mph/46.3 kph. The National Hurricane Center noted at 0300 UTC on Oct. 17/11 p.m. EDT Oct. 16, that Priscilla ceased to qualify as a tropical cyclone.
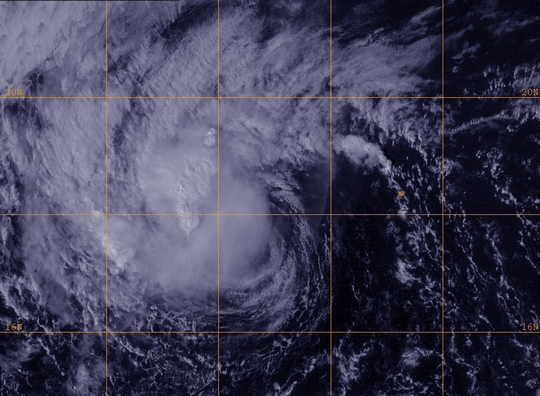
Tropical Storm Narda Was a Sea Storm in the Eastern Pacific Ocean
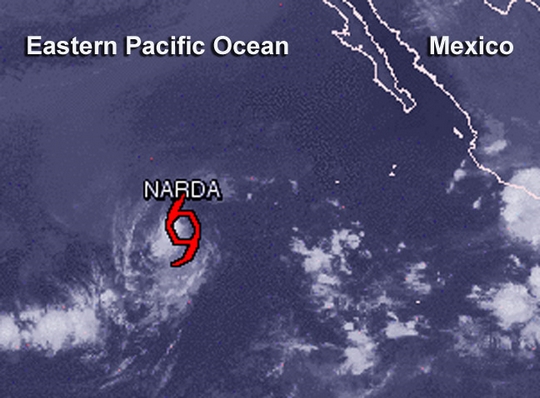 Tropical Storm Narda formed almost 900 miles away from the southern tip of Baja California on Oct. 6, staying away from land areas throughout its life. Narda strengthened to near hurricane force then weakened while traveling out into the open waters of the Eastern Pacific because of wind shear and dry air.
Narda developed from Tropical Depression 14-E, which formed on Oct. 6 near 12.9 north and 118.5 west. That put the center of the depression about 890 miles/1,425 km southwest of Baja California's southern tip. The depression had maximum sustained winds near 35 mph/55 kph and headed west at 12 mph/19 kph. Later in the day, by 11 p.m. EDT, the depression strengthened into Tropical Storm Narda and maximum sustained winds were near 40 mph/65 kph. Twenty-four hours later (on Oct. 7) Narda's maximum sustained winds peaked near 65 mph/100 kph when it was located near 14.6 north and 125.0 west. It was still moving at 12 mph/19 kph, but its track shifted to the west-northwest.
On Oct. 8, forecasters at the National Hurricane Center noted that they didn't expect Narda to reach hurricane status because it was moving into a more unwelcome environment. Narda's maximum sustained winds dropped to 60 mph/95 kph and it was then 1,140 miles/1,825 km west-southwest of the Baja's southern tip.
On Oct. 9, Narda had moved to about 1,265 miles/2,040 km west-southwest of the southern tip of Baja California and its winds had dropped to 35 mph/55 kph, making it a depression. Narda still hung onto depression status on Oct. 10 and maintained the same maximum sustained wind speed. The storm had slowed to a crawl at 2 mph/4 kph and was about near 16.4 north and 128.9 west, about 1,315 miles/2,115 km west-southwest of the southern tip of Baja California.
Tropical Storm Narda formed almost 900 miles away from the southern tip of Baja California on Oct. 6, staying away from land areas throughout its life. Narda strengthened to near hurricane force then weakened while traveling out into the open waters of the Eastern Pacific because of wind shear and dry air.
Narda developed from Tropical Depression 14-E, which formed on Oct. 6 near 12.9 north and 118.5 west. That put the center of the depression about 890 miles/1,425 km southwest of Baja California's southern tip. The depression had maximum sustained winds near 35 mph/55 kph and headed west at 12 mph/19 kph. Later in the day, by 11 p.m. EDT, the depression strengthened into Tropical Storm Narda and maximum sustained winds were near 40 mph/65 kph. Twenty-four hours later (on Oct. 7) Narda's maximum sustained winds peaked near 65 mph/100 kph when it was located near 14.6 north and 125.0 west. It was still moving at 12 mph/19 kph, but its track shifted to the west-northwest.
On Oct. 8, forecasters at the National Hurricane Center noted that they didn't expect Narda to reach hurricane status because it was moving into a more unwelcome environment. Narda's maximum sustained winds dropped to 60 mph/95 kph and it was then 1,140 miles/1,825 km west-southwest of the Baja's southern tip.
On Oct. 9, Narda had moved to about 1,265 miles/2,040 km west-southwest of the southern tip of Baja California and its winds had dropped to 35 mph/55 kph, making it a depression. Narda still hung onto depression status on Oct. 10 and maintained the same maximum sustained wind speed. The storm had slowed to a crawl at 2 mph/4 kph and was about near 16.4 north and 128.9 west, about 1,315 miles/2,115 km west-southwest of the southern tip of Baja California.
Satellite Sees Extra-Tropical Typhoon Wipha Affecting Alaska
 Dry air was wrapping into Narda on Oct. 10 as wind shear increased. Those two factors were sapping the storm's strength. By Oct. 12, Narda had dissipated in the Eastern Pacific Ocean.Powerful Typhoon Wipha never made landfall in the northwestern Pacific but affected several land areas there as seen by NASA's Aqua and Terra satellites. By Oct. 18, extra-tropical storm Wipha moved into the Bering Sea and was bringing rains, warmer temperatures and gusty winds to Alaska.NOAA's GOES-West satellite captured an infrared image of ex-typhoon Wipha's clouds over Alaska on Oct. 18 at 1200 UTC/8 a.m. EDT. Forecasters at the National Weather Service in Fairbanks, AK highlighted Wipha's effects on Alaska from Oct. 18 through Oct. 20: Southeast to northeast winds will increase to 25 to 35 knots across all the west coast marine zones during the evening on Oct. 19 as the low center approaches southwest Alaska. Ample moisture will also spread into western Alaska with up to 1 inch of rain likely. On Oct. 18 and 19, rainfall amounts could be higher. Forecasters noted that the Alaska Range will continue to block much of the eastern half of the state from Wipha's effects.Typhoon Wipha was born of the twenty-fifth tropical depression in the northwestern Pacific Ocean. It developed far south of the Japanese Island of Iwo To, tracked northwest, then curved northeast passing and almost paralleling the coast of the big island of Japan while its center never made landfall.On Oct. 13 at 2113 UTC/5:13 p.m. EDT, NASA and the Japan Space Agency's Tropical Rainfall Measuring Mission or TRMM satellite flew over Wipha and measured rainfall rates. Heaviest rains were occurring to the north and northeast of the center of circulation, falling at a rate of greater than 1 inch per hour.
By Oct. 14 at 0300 UTC, Wipha's maximum sustained winds reached an impressive 110 knots/126.6 mph/203.7 kph. At that time Wipha was centered near 22.2 north and 135.3 east, about 370 nautical miles west-southwest of Iwo To, Japan. Wipha was moving to the north-northwest at 13 knots/14.9 mph/24.0 kph and generating extremely rough seas up to 41 feet high.Wipha's center is expected to graze Tokyo on Oct. 16 while remaining at sea and moving parallel to the Japanese east coast and swing into the northern Pacific.On Oct. 13, the Joint Typhoon Warning Center noted "animated multispectral satellite imagery depicts a large system with tight spiral banding wrapping into a low level circulation center with an eye that has contracted and become more ragged over the past six hours."Wipha's final warning was issued on Oct. 15 by the Joint Typhoon Warning Center. Wipha's maximum sustained winds were near 65 knots/74.8 mph/120.4 kph. At 2100 UTC/5:00 p.m. EDT Wipha's center was near 34.3 north and 140.4 east, about 161 nautical miles south-southwest of Yokosuka, Japan. It was moving northeastward at 30 knots/34.5 mph/55.5 kph at that time.Animated infrared satellite imagery showed the system continued to accelerate northward and had become more disorganized and elongated, especially along the northern edge.Then a tropical storm, Wipha continued moving northeastward ahead of a trough of low pressure where it began transitioning into an extra-tropical storm over cooler waters. Wipha crossed the Pacific Ocean and moved into the Bering Sea where it began lashing Alaska on Oct. 17 and 18 with strong winds, unseasonably warm temperatures and heavy rainfall.On Oct. 18, the National Weather Service noted that ex-typhoon Wipha moved into the Southern Bering Sea and will slowly fill as it arcs northeast to Nunivak Island on Saturday, Oct. 19 and then drift northwest and dissipate south of Saint Lawrence Island on Sunday, Oct. 20
Dry air was wrapping into Narda on Oct. 10 as wind shear increased. Those two factors were sapping the storm's strength. By Oct. 12, Narda had dissipated in the Eastern Pacific Ocean.Powerful Typhoon Wipha never made landfall in the northwestern Pacific but affected several land areas there as seen by NASA's Aqua and Terra satellites. By Oct. 18, extra-tropical storm Wipha moved into the Bering Sea and was bringing rains, warmer temperatures and gusty winds to Alaska.NOAA's GOES-West satellite captured an infrared image of ex-typhoon Wipha's clouds over Alaska on Oct. 18 at 1200 UTC/8 a.m. EDT. Forecasters at the National Weather Service in Fairbanks, AK highlighted Wipha's effects on Alaska from Oct. 18 through Oct. 20: Southeast to northeast winds will increase to 25 to 35 knots across all the west coast marine zones during the evening on Oct. 19 as the low center approaches southwest Alaska. Ample moisture will also spread into western Alaska with up to 1 inch of rain likely. On Oct. 18 and 19, rainfall amounts could be higher. Forecasters noted that the Alaska Range will continue to block much of the eastern half of the state from Wipha's effects.Typhoon Wipha was born of the twenty-fifth tropical depression in the northwestern Pacific Ocean. It developed far south of the Japanese Island of Iwo To, tracked northwest, then curved northeast passing and almost paralleling the coast of the big island of Japan while its center never made landfall.On Oct. 13 at 2113 UTC/5:13 p.m. EDT, NASA and the Japan Space Agency's Tropical Rainfall Measuring Mission or TRMM satellite flew over Wipha and measured rainfall rates. Heaviest rains were occurring to the north and northeast of the center of circulation, falling at a rate of greater than 1 inch per hour.
By Oct. 14 at 0300 UTC, Wipha's maximum sustained winds reached an impressive 110 knots/126.6 mph/203.7 kph. At that time Wipha was centered near 22.2 north and 135.3 east, about 370 nautical miles west-southwest of Iwo To, Japan. Wipha was moving to the north-northwest at 13 knots/14.9 mph/24.0 kph and generating extremely rough seas up to 41 feet high.Wipha's center is expected to graze Tokyo on Oct. 16 while remaining at sea and moving parallel to the Japanese east coast and swing into the northern Pacific.On Oct. 13, the Joint Typhoon Warning Center noted "animated multispectral satellite imagery depicts a large system with tight spiral banding wrapping into a low level circulation center with an eye that has contracted and become more ragged over the past six hours."Wipha's final warning was issued on Oct. 15 by the Joint Typhoon Warning Center. Wipha's maximum sustained winds were near 65 knots/74.8 mph/120.4 kph. At 2100 UTC/5:00 p.m. EDT Wipha's center was near 34.3 north and 140.4 east, about 161 nautical miles south-southwest of Yokosuka, Japan. It was moving northeastward at 30 knots/34.5 mph/55.5 kph at that time.Animated infrared satellite imagery showed the system continued to accelerate northward and had become more disorganized and elongated, especially along the northern edge.Then a tropical storm, Wipha continued moving northeastward ahead of a trough of low pressure where it began transitioning into an extra-tropical storm over cooler waters. Wipha crossed the Pacific Ocean and moved into the Bering Sea where it began lashing Alaska on Oct. 17 and 18 with strong winds, unseasonably warm temperatures and heavy rainfall.On Oct. 18, the National Weather Service noted that ex-typhoon Wipha moved into the Southern Bering Sea and will slowly fill as it arcs northeast to Nunivak Island on Saturday, Oct. 19 and then drift northwest and dissipate south of Saint Lawrence Island on Sunday, Oct. 20
Deadly Cyclone Phailin Makes Landfall in Eastern India
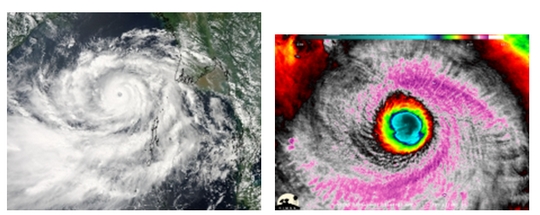 The second tropical cyclone of the Northern Indian Ocean season formed on Oct. 9 and grew into powerful Typhoon Phailin that made landfall in eastern India. NASA's Aqua and NASA/NOAA's Suomi-NPP satellites captured imagery of the storm on its approach to land.
On Oct. 9, Tropical Depression 02B formed from low pressure System 90W about 537 nautical miles south of Chittagong, Bangladesh, near 13.4 North and 92.8 East. TD02B quickly strengthened into a tropical storm and was named Phailin. Phailin moved to the west-northwest at 7 knots after forming. Tropical Storm Phailian had maximum sustained winds near 40 knots/46.0 mph/74.0 kph shortly after its birth.
On Oct. 10 at 0720 UTC/3:20 a.m. EDT, the MODIS instrument aboard NASA's Aqua satellite captured a visible image of Typhoon Phailin in the Bay of Bengal as it headed for landfall in west-central India. On Oct. 11, Phailin reached peak speed with maximum sustained winds near 152 knots/175 mph/281.6 kph.
It was on Oct. 11 when NASA/NOAA's Suomi NPP satellite passed almost directly over Typhoon Phailin. At that time, the VIIRS instrument aboard captured a high-resolution infrared image of the storm, clearly showing the storm's eye. Because Suomi-NPP is a polar-orbiting satellite, VIIRS could only view Phailin twice a day. But, VIIRS produced infrared imagery at 375 meter resolution. For additional information on Phailin using Suomi-NPP imagery, visit: http://tinyurl.com/q3d3xpu.
On Oct. 12 during the morning (Eastern Daylight Time/U.S.) Phailin was the strength of a Category 4 hurricane, according to the Saffir-Simpson hurricane scale. The Joint Typhoon Warning Center noted that Phailin had maximum sustained winds near 150 mph/241.4 kph.
On Oct. 12, Phailin's center was approaching the coast of the state of Odisha, and made landfall between Brahmapur to the north, and Visakhapatnam to the south. The storm came ashore with maximum sustained winds near 125 mph/250 kph. A strong storm surge brought seawater into farms and fields, and caused coastal flooding and structural damage, according to Reuters news. A mass evacuation in Odisha and the adjacent Andhra Pradesh saved many lives from Phailin's wrath. The U.K. Daily Mail indicated that Phailin took 17 lives.
The second tropical cyclone of the Northern Indian Ocean season formed on Oct. 9 and grew into powerful Typhoon Phailin that made landfall in eastern India. NASA's Aqua and NASA/NOAA's Suomi-NPP satellites captured imagery of the storm on its approach to land.
On Oct. 9, Tropical Depression 02B formed from low pressure System 90W about 537 nautical miles south of Chittagong, Bangladesh, near 13.4 North and 92.8 East. TD02B quickly strengthened into a tropical storm and was named Phailin. Phailin moved to the west-northwest at 7 knots after forming. Tropical Storm Phailian had maximum sustained winds near 40 knots/46.0 mph/74.0 kph shortly after its birth.
On Oct. 10 at 0720 UTC/3:20 a.m. EDT, the MODIS instrument aboard NASA's Aqua satellite captured a visible image of Typhoon Phailin in the Bay of Bengal as it headed for landfall in west-central India. On Oct. 11, Phailin reached peak speed with maximum sustained winds near 152 knots/175 mph/281.6 kph.
It was on Oct. 11 when NASA/NOAA's Suomi NPP satellite passed almost directly over Typhoon Phailin. At that time, the VIIRS instrument aboard captured a high-resolution infrared image of the storm, clearly showing the storm's eye. Because Suomi-NPP is a polar-orbiting satellite, VIIRS could only view Phailin twice a day. But, VIIRS produced infrared imagery at 375 meter resolution. For additional information on Phailin using Suomi-NPP imagery, visit: http://tinyurl.com/q3d3xpu.
On Oct. 12 during the morning (Eastern Daylight Time/U.S.) Phailin was the strength of a Category 4 hurricane, according to the Saffir-Simpson hurricane scale. The Joint Typhoon Warning Center noted that Phailin had maximum sustained winds near 150 mph/241.4 kph.
On Oct. 12, Phailin's center was approaching the coast of the state of Odisha, and made landfall between Brahmapur to the north, and Visakhapatnam to the south. The storm came ashore with maximum sustained winds near 125 mph/250 kph. A strong storm surge brought seawater into farms and fields, and caused coastal flooding and structural damage, according to Reuters news. A mass evacuation in Odisha and the adjacent Andhra Pradesh saved many lives from Phailin's wrath. The U.K. Daily Mail indicated that Phailin took 17 lives.
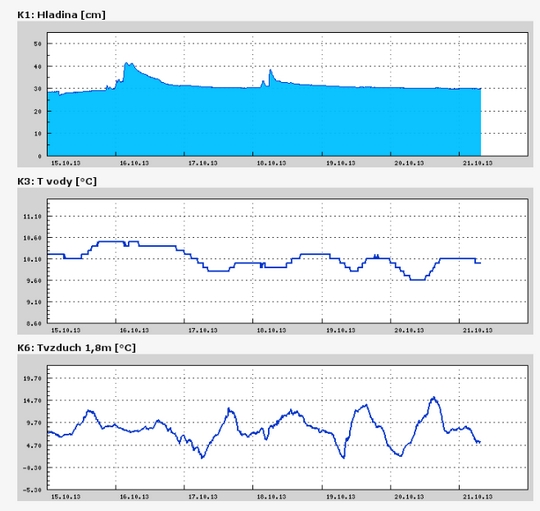
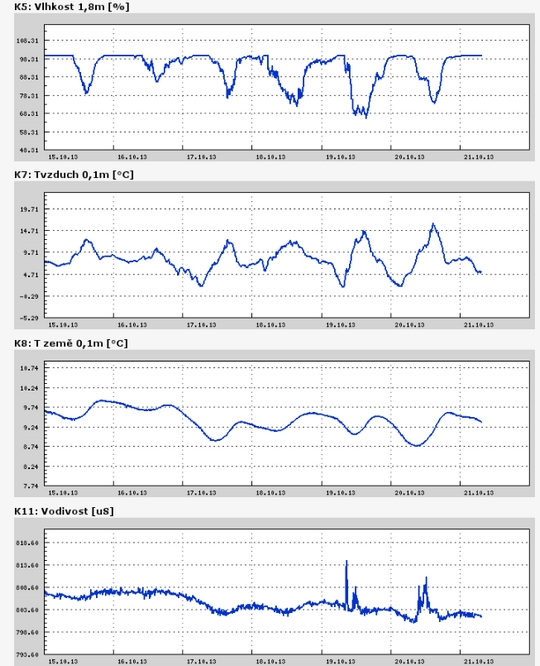
Teplota vzduchu a vody, vlhkost ,
 https://stanice.fiedler-magr.cz
Archiv
35_201334_2013
33_2013
32_2013
31_2013
30_2013
29_2013
28_2013
27_2013
26_2013
25_2013
24_2013
23_2013
22_2013
21_2013
20_2013
19_2013
18_2013
17_2013
16_2013
15_2013
14_2013
13_2013
12_2013
11_2013
10_2013
09_2013
08_2013
07_2013
06_2013
05_2013
04_2013
03_2013
02_2013
01_2013

 | Zemědělská 1/1665 613 00 Brno Budova D | Tel.: +420 545 133 350 Fax.: +420 545 212 044 |  |
 |