

Dobrá díla jsou plodem dobrého charakteru a protože je chvályhodnější příčina než následek, chval více dobrý charakter bez vzdělání než vzdělance bez charakteru.
Leonardo da Vinci
Konference
Konference v roce 2015
Konference v roce 2014
Konference v roce 2013
Konference v roce 2012
Konference v roce 2011

Polní laboratoř
Gravity Waves and Sunglint, Lake Superior
 From the vantage point of the International Space Station, astronauts frequently observe atmospheric and surface phenomena in ways that are impossible to view from the ground. Two such phenomena—gravity waves and sunglint—are illustrated in this photograph of northeastern Lake Superior. At the top of the image, the Canadian Shield of southern Ontario is covered by an extensive forest canopy typical of early summer. Offshore and to the west and southwest of Pukaskwa National Park, several distinct sets of parallel cloud bands are visible. Gravity waves are produced when moisture-laden air encounters imbalances in air density, such as might be expected when cool air flows over warmer air. This can cause the flowing air to oscillate up and down as it moves, causing clouds to condense as the air rises and cools and to evaporate away as the air sinks and warms. This produces parallel bands of clouds oriented perpendicular to the wind direction. The orientation of the cloud bands in this image, parallel to the coastlines, suggests that air flowing off of the land surfaces to the north is interacting with moist, stable air over the lake surface, creating gravity waves. The second phenomenon—sunglint—affects the water surface around and to the northeast of Isle Royale. Sunglint is caused by light reflection off a water surface; some of the reflected light travels directly back towards the observer, resulting in a bright mirror-like appearance over large expanses of water. Water currents and changes in surface tension—typically caused by presence of oils or surfactants—alter the reflective properties of the water and can be highlighted by sunglint. For example, surface water currents are visible to the east of Isle Royale that are oriented similarly to the gravity waves, suggesting that they too are the product of winds moving off of the land surface. Astronaut photograph ISS036-E-11843 was acquired on June 24, 2013, with a Nikon D3S digital camera using a 50 millimeter lens, and is provided by the ISS Crew Earth Observations experiment and Image Science & Analysis Laboratory, Johnson Space Center. The image was taken by the Expedition 36 crew. It has been cropped and enhanced to improve contrast, and lens artifacts have been removed.
 The International Space Station Program supports the laboratory as part of the ISS National Lab to help astronauts take pictures of Earth that will be of the greatest value to scientists and the public, and to make those images freely available on the Internet. Additional images taken by astronauts and cosmonauts can be viewed at the NASA/JSC Gateway to Astronaut Photography of Earth. Image Credit: NASA Caption: William L. Stefanov (Jacobs/JETS) and Michael H. Trenchard (Barrios/JETS), NASA Johnson Space Center
NASA Sees Newborn Eastern Atlantic Tropical Depression
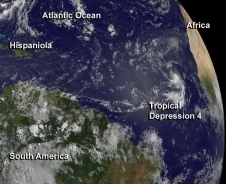
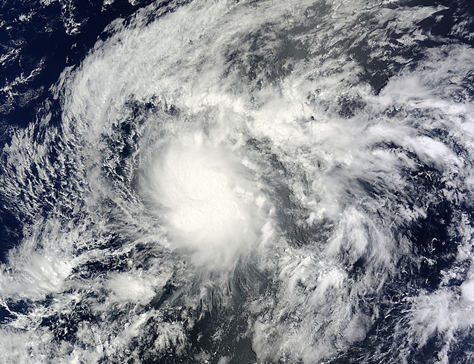
 NOAA's GOES-13 satellite captured this view of Tropical Depression 4 in the far eastern Atlantic Ocean on July 24 at 11:45 UTC (7:45 a.m. EDT).
The fourth tropical depression of the Atlantic Ocean hurricane season was born west of the Cape Verde Islands in the Eastern Atlantic Ocean on July 24. NOAA's GOES-13 satellite provides continuous views of the Atlantic Ocean basin and captured an image of the newborn storm.At 5 a.m. EDT on July 24, the National Hurricane Center announced the birth of Tropical Depression 4 or TD4. At that time TD4 had maximum sustained winds near 35 mph (55 kph). It was centered about 310 miles (500 km) west-southwest of the Cape Verde Islands, near 13.9 north and 28.1 west. TD4 was moving to the west-northwest at 20 mph (32 kph) and had a minimum central pressure of 1008 millibars. NOAA's eastern Geostationary Operational Environmental Satellite known as GOES-13 captured a visible image of Tropical Depression 4 in the far eastern Atlantic Ocean on July 24 at 11:45 UTC (7:45 a.m. EDT). The image was created by the NASA GOES Project located at NASA's Goddard Space Flight Center in Greenbelt, Md.
The image showed that the storm had become more organized overnight, and strong convection (rising air that forms thunderstorms that make up the tropical depression) had increased in coverage and become more concentrated around the center. The National Hurricane Center noted that TD4 may strengthen slightly and reach tropical storm status later in the day or on July 25 before running into drier air and cooler waters. Dry air absorbs the moisture needed to form thunderstorms, and tropical cyclones need water temperatures of at least 80F/26.6C to maintain strength.
If TD4 strengthens into a tropical storm it would be renamed Dorian.
Tropical Storm Flossie formed in the Eastern Pacific Ocean
 The swirling eye of Typhoon Soulik as it approached Taiwan last Friday is caught by a tiny espresso cup-sized camera on one of ESA’s smallest satellites, Proba-2. This X-Cam image of Typhoon Soulik was acquired on 12 July at 10:14 GMT. Less than a cubic metre in size, Proba-2 focuses on observing solar activity and space weather. But it also keeps a small eye on its homeworld. Among the 17 experimental technologies hosted on Proba-2 is the compact Exploration Camera, X-Cam. Housed on the underside of the satellite, the monochrome X-Cam observes in the visible and infrared with a 100° field of view.
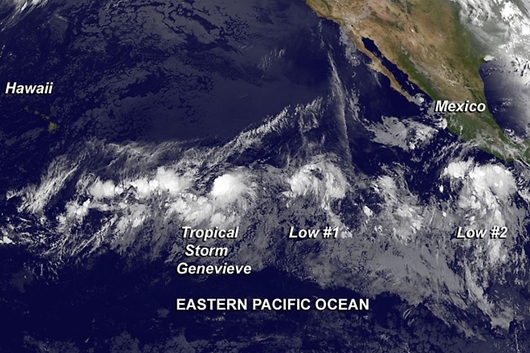
and strengthened quickly on July 25. NASA's Aqua satellite passed over Flossie and captured an infrared look at the storm and saw a large area of powerful thunderstorms around its center and south of the center. The Atmospheric Infrared Sounder or AIRS instrument flies aboard NASA's Aqua satellite. AIRS captured an infrared image of Tropical Storm Flossie on July 25 at 10:05 UTC (6:05 a.m. EDT). Infrared data helps determine temperature, such as the cloud top and sea surface temperatures. AIRS data revealed that Flossie's strongest storms and heaviest rains were around its center and in a fragmented band of thunderstorms south of the center. Those areas had cloud top temperatures near -63F/-52C, indicating very high thunderstorms. The National Hurricane Center or NHC noted that at 8 a.m. PDT (11 a.m. EDT) the center of Tropical Storm Flossie was near latitude 15.3 north and longitude 125.6 west. Flossie is moving toward the west near 16 mph (26 kph) and is expected to continue in that direction for the next couple of days. Flossie's maximum sustained winds remain near 40 mph (65 kph) and NHC expects some strengthening during the next 48 hours. The estimated minimum central pressure is 1003 millibars.
The NHC's current forecast track takes Flossie toward Hawaii as a depression by Tuesday, July 30.
NASA's Various Views of Tropical Storm Dorian
 This night-time, infrared image of Tropical Storm Dorian was taken from the VIIRS instrument aboard the Suomi-NPP satellite on July 25 at 03:52 UTC. The red and purple areas are very high thunderstorms.
Suomi-NPP satellite flew over Tropical Storm Dorian on July 25 at 03:52 UTC (July 24 at 11:52 p.m. EDT). At that time the Visible Infrared Imager Radiometer Suite or VIIRS instrument that flies aboard the satellite captured a night-time, infrared image of Tropical Storm Dorian. VIIRS data showed that the thunderstorms that surround the center of circulation were as cold as 195 to 200 kelvin. Those frigid temperatures indicate very high thunderstorms shooting to the top of the troposphere (lowest layer of atmosphere).
VIIRS, a scanning radiometer, collects visible and infrared imagery and radiometric measurements. VIIRS data is used to measure cloud and aerosol properties, ocean color, sea and land surface temperature, ice motion and temperature, fires, and Earth's albedo.
An Aqua Satellite View
 On July 25 at 11:59 a.m. EDT, AIRS data showed Dorian had strong thunderstorms (purple) around its center and in a fragmented band wrapping into the center from the south.
Image Credit:
NASA/JPL, Ed Olsen
Image Token:
The Atmospheric Infrared Sounder or AIRS instrument also captures infrared data and captured data on Dorian hours after VIIRS. AIRS flies aboard NASA's Aqua satellite and flew over Dorian on July 25 at 15:59 UTC (11:59 a.m. EDT). AIRS data showed that Dorian maintained strong thunderstorms around its center. AIRS also showed an extended band of fragmented thunderstorms wrapping into Dorian's center from the south and southwest.
AIRS data also showed that Dorian had moved back into warmer sea surface temperatures between 300 (80F/26.8C) and 310 Kelvin (98.3F/36.8C).
TRMM Satellite View
 The TRMM satellite passed over Dorian at 9:39 p.m. EDT on July 25, and saw mostly light to moderate rainfall (blue/green) near the center.
When NASA and the Japan Space Agency's Tropical Rainfall Measuring Mission or TRMM satellite passed over Dorian on July 26 at 01:39 UTC (9:39 p.m. EDT on July 25), the instruments aboard measured the rainfall rates occurring within the storm. Mostly light to moderate rainfall was found near Dorian's center of circulation by TRMM's Microwave Imager (TMI) and Precipitation Radar (PR) instruments. TRMM imagery is created at NASA's Goddard Space Flight Center in Greenbelt, Md. where TRMM precipitation data is placed atop a visible/infrared image from TRMM's Visible and InfraRed Scanner to form a complete picture.
Where is Dorian?[
At 5 a.m. EDT (0900 UTC) on Friday, July 26, Dorian's maximum sustained winds had slowed to 50 mph (85 kph). The National Hurricane Center or NHC noted that Dorian has become less organized. Dorian was centered near 17.1 north latitude and 41.5 west longitude, about 1,425 miles (2,290 km) east of the Northern Leeward Islands. Dorian is moving to the west-northwest at 20 mph (32 kph). There were no warnings or watches in effect as of 5 a.m. EDT.
NHC noted that Dorian's disorganization is possibly due to a combination of southwesterly vertical wind shear and mid to upper-level dry air seen in water vapor imagery.
As the AIRS data showed on July 25, the convective area (showers and thunderstorms) has become elongated from north to south.
Dorian is expected to continue moving west-northwest and in 4 or 5 days (by Monday, July 29); NOAA forecasts take the storm over Hispaniola.
July 25, 2013 - NASA Puts Tropical Storm Dorian in the Infrared Spotlight
 The AIRS instrument aboard NASA's Aqua satellite captured this infrared image of Tropical Storm Dorian on July 25 at 03:29 UTC (11:29 p.m. EDT, July 24). Strongest storms and heaviest rains are around the center and in a band of thunderstorms south of the center with cloud top temperatures near -63F/-52C (purple).
The newest tropical storm to form in the Atlantic was put in NASA's "infrared spotlight." NASA's AIRS instrument uses infrared imaging to analyze tropical cyclones and captured an image of newborn Tropical Storm Dorian.
NASA's Atmospheric Infrared Sounder instrument also known as AIRS, flies aboard the Aqua satellite. AIRS uses infrared light and shined that light on Tropical Storm Dorian on July 25 at 03:29 UTC (11:29 p.m. EDT, July 24). Infrared data helps determine temperature, such as the cloud top and sea surface temperatures. AIRS data revealed that Dorian's strongest storms and heaviest rains were around its center and in a band of thunderstorms south of the center. Those areas had cloud top temperatures near -63F/-52C, indicating very high thunderstorms.Forecasters at the National Hurricane Center kept a close eye on Dorian over the last 24 hours as it traversed cooler sea surface temperatures, and survived. Dorian is now moving over and toward warmer waters.
 NASA's TRMM satellite flew over tropical storm Dorian on July 24 at 1648 UTC and the TMI and PR instruments saw light to moderate rainfall (blue/green) near the center of circulation. Precipitation is shown overlaid on a visible/infrared image from TRMM's Visible and InfraRed Scanner (VIRS).
The official position of Tropical Storm Dorian at 11 a.m. EDT (1500 UTC), was about 1,800 miles (2,900 km) east of the northern Leeward Islands, near 16.0 north and 35.9 west, according to the National Hurricane Center or NHC. The NHC noted that Dorian's maximum sustained winds were near 60 mph (95 kph) and some fluctuations in intensity are expected in the next couple of days. The tropical-storm-force winds extend outward up to 60 miles (95 km) from the center, making Dorian about 120 miles (190 km) in diameter.
Dorian was moving toward the west-northwest near 17 mph (28 kph) and that general motion is expected to continue today, followed by a gradual turn toward the west on Friday, July 26. The estimated minimum central pressure is 999 millibars.
The NHC expects Dorian to continue to move west-northwest across the Atlantic.
July 24, 2013 - NASA's TRMM Satellite Sees Tropical Storm Dorian Forming
 On July 23, 2013 at 0253 UTC,NASA's TRMM satellite captured an image of the tropical wave that spawned Tropical Storm Dorian and revealed that it had become much more organized that it was on July 22, 2013 at 1703 UTC when TRMM previously passed over the storm.
On July 23, 2013 at 0253 UTC,NASA's TRMM satellite captured an image of the tropical wave that spawned Tropical Storm Dorian and revealed that it had become much more organized that it was on July 22, 2013 at 1703 UTC when TRMM previously passed over the storm.
On July 23, 2013 at 0253 UTC,NASA's TRMM satellite captured an image of the tropical wave that spawned Tropical Storm Dorian and revealed that it had become much more organized that it was on July 22, 2013 at 1703 UTC when TRMM previously passed over the storm.
Analyses of rainfall from TRMM's Microwave Imager (TMI) and Precipitation Radar (PR) were overlaid on Visible and InfraRed Scanner (VIRS) data. A combination visible and infrared VIRS image is shown overlaid with precipitation in the early evening at 1703 UTC. An enhanced infrared image alone, from TRMM's VIRS instrument, was used as an underlay in the early morning 0253 UTC view on the right. The area covered by the TRMM PR instrument is shown as a slightly lighter shade.
The National Hurricane Center (NHC) upgraded the low pressure center to tropical depression four (TD04) on July 24, 2013 at 0900 UTC (5 a.m. EDT) and then to tropical storm Dorian at 1500 UTC (11 a.m. EDT). Dorian is the fourth named tropical storm in the 2013 Atlantic hurricane season. Dorian is predicted to remain a tropical storm with winds no greater than 40 knots (46 mph) while moving into the central Atlantic.
On average, the 4th named storm doesn't occur until around August 23rd, an indication that the 2013 season is off to a fast start. The fact that tropical storm Dorian formed near the Cape Verde Islands is also somewhat unusual. Although they can occur in July, Cape Verde-type storms typically don't form until August and September, and 2013 has almost had one earlier in July--Tropical Storm Chantal.
July 23, 2013 - NASA Sees Newborn Eastern Atlantic Tropical Depression
 NOAA's GOES-13 satellite captured this view of Tropical Depression 4 in the far eastern Atlantic Ocean on July 24 at 11:45 UTC (7:45 a.m. EDT).
The fourth tropical depression of the Atlantic Ocean hurricane season was born west of the Cape Verde Islands in the Eastern Atlantic Ocean on July 24. NOAA's GOES-13 satellite provides continuous views of the Atlantic Ocean basin and captured an image of the newborn storm.
At 5 a.m. EDT on July 24, the National Hurricane Center announced the birth of Tropical Depression 4 or TD4. At that time TD4 had maximum sustained winds near 35 mph (55 kph). It was centered about 310 miles (500 km) west-southwest of the Cape Verde Islands, near 13.9 north and 28.1 west. TD4 was moving to the west-northwest at 20 mph (32 kph) and had a minimum central pressure of 1008 millibars.
NOAA's eastern Geostationary Operational Environmental Satellite known as GOES-13 captured a visible image of Tropical Depression 4 in the far eastern Atlantic Ocean on July 24 at 11:45 UTC (7:45 a.m. EDT). The image was created by the NASA GOES Project located at NASA's Goddard Space Flight Center in Greenbelt, Md.
The image showed that the storm had become more organized overnight, and strong convection (rising air that forms thunderstorms that make up the tropical depression) had increased in coverage and become more concentrated around the center.
The National Hurricane Center noted that TD4 may strengthen slightly and reach tropical storm status later in the day or on July 25 before running into drier air and cooler waters. Dry air absorbs the moisture needed to form thunderstorms, and tropical cyclones need water temperatures of at least 80F/26.6C to maintain strength.
If TD4 strengthens into a tropical storm it would be renamed Dorian
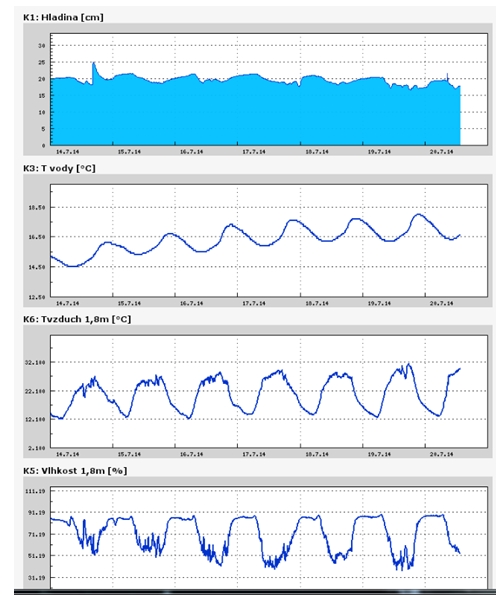
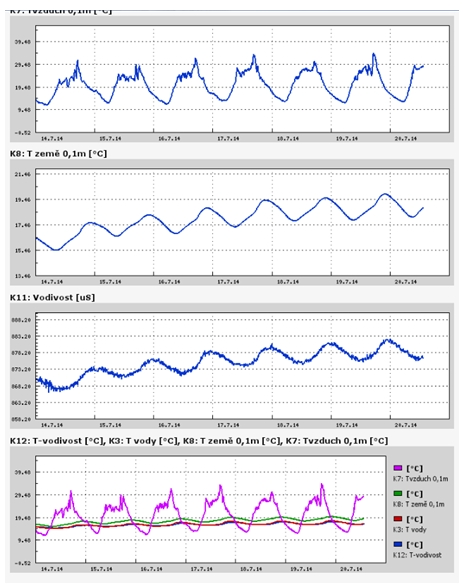
Teplota vzduchu a vody, vlhkost ,
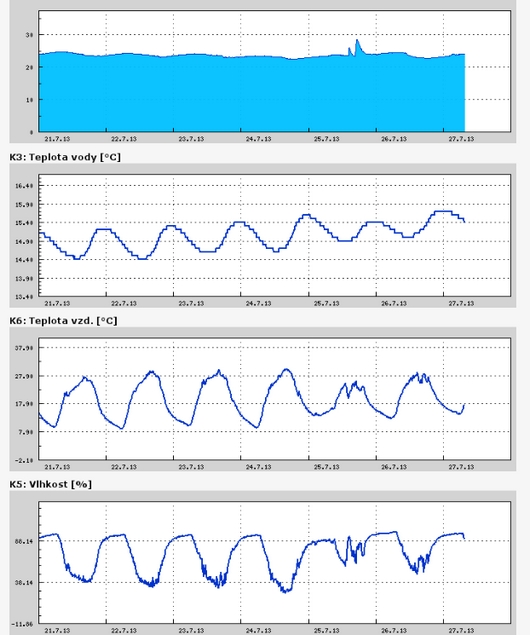 https://stanice.fiedler-magr.cz
Archiv
26_201325_2013
24_2013
23_2013
22_2013
21_2013
20_2013
19_2013
18_2013
17_2013
16_2013
15_2013
14_2013
13_2013
12_2013
11_2013
10_2013
09_2013
08_2013
07_2013
06_2013
05_2013
04_2013
03_2013
02_2013
01_2013

 | Zemědělská 1/1665 613 00 Brno Budova D | Tel.: +420 545 133 350 Fax.: +420 545 212 044 |  |
 |


